
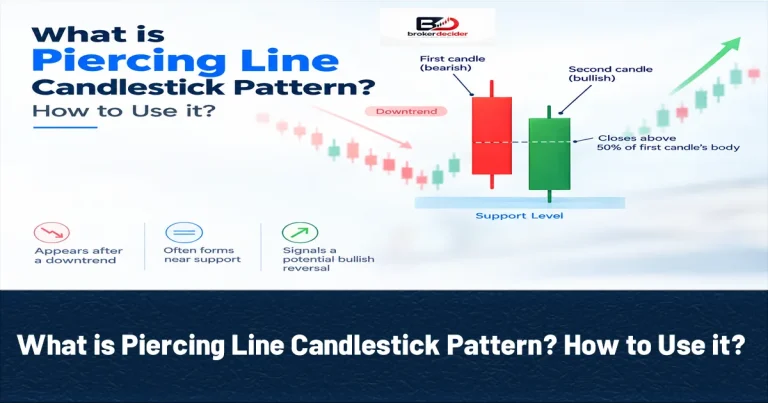
The Piercing Line Candlestick Pattern is a two-candle bullish reversal pattern that can appear after a sustained downtrend. It suggests that sellers were initially in control, but buyers entered strongly during the next session and pushed price significantly higher. For Forex traders, the pattern can provide an early indication that bearish momentum is weakening, especially when it forms near a meaningful support level.
Piercing Line Candlestick Pattern
A Piercing Line consists of two consecutive bearish and bullish candles. The first candle is typically a relatively large bearish candle, showing strong selling pressure. The second candle opens below the previous candle’s close and then moves sharply higher, closing above the midpoint of the first candle’s real body. The basic structure is:
Strong bearish candle → Bullish recovery
The deeper the second candle penetrates into the first candle’s body, the stronger the bullish signal is generally considered. Ideally, the second candle closes well above the 50% level of the previous bearish candle’s body but below its opening price.
Reading Piercing Line Candlestick Pattern
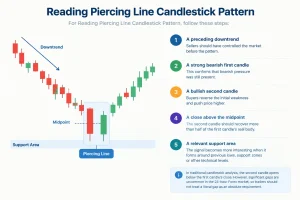
For Reading Piercing Line Candlestick Pattern, follow these steps:
- A preceding downtrend: Sellers should have controlled the market before the pattern.
- A strong bearish first candle: This confirms that bearish pressure was still present.
- A bullish second candle: Buyers reverse the initial weakness and push price higher.
- A close above the midpoint: The second candle should recover more than half of the first candle’s real body.
- A relevant support area: The signal becomes more interesting when it forms around previous lows, support zones or other technical levels.
In traditional candlestick analysis, the second candle opens below the first candle’s close. However, significant gaps are uncommon in the 24-hour Forex market, so traders should not treat a literal gap as an absolute requirement.
Read More: What is Harami Candlestick Pattern? How to Use it?
Trading Strategy of Piercing Line Candlestick Pattern
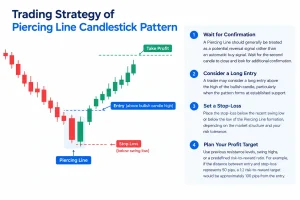
A Piercing Line should generally be treated as a potential reversal signal rather than an automatic buy signal. One approach is to wait for the second candle to close and then look for additional confirmation. A trader may consider a long entry above the high of the bullish candle, particularly when the pattern forms at established support.
The stop-loss can be placed below the recent swing low or below the low of the Piercing Line formation, depending on the market structure and the trader’s risk tolerance. For profit targets, traders can use previous resistance levels, swing highs or a predefined risk-to-reward ratio. For example, if the distance between entry and stop-loss represents 50 pips, a 1:2 risk-to-reward target would be approximately 100 pips from the entry.
Bullish Engulfing and Piercing Line
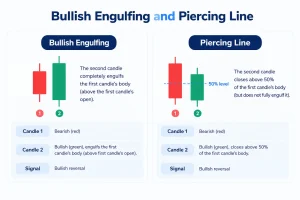
Both Bullish Engulfing and Piercing Line have 2 Candles. The first one is Bearish and the second one is Bullish. Second close for Piercing Line is Above 50% of first body but for Bullish Engulfing is Above first candle’s open. The Signal for both Pattern is Bullish reversal too.
Read More: What is Three Black Crows Candlestick Pattern? How to Use it?
Common Mistakes When Trading With Piercing Line
Common Mistakes When Trading With Piercing Line are:
- Entering before the second candle closes
- Ignoring nearby resistance
- Placing the stop-loss without considering market structure
- Treating the pattern as confirmation of a guaranteed reversal
- Using the pattern without checking the higher timeframe
- Ignoring volatility and overall market conditions
Conclusion about Piercing Line
The Piercing Line Candlestick Pattern is a useful two-candle formation for identifying potential bullish reversals after a decline. Its strongest setups usually occur when a clear downtrend meets an important support area and the second candle demonstrates a decisive recovery.
Read More: What Is Three White Soldiers Candlestick Pattern? How to Trade It?
Visit Broker Decider Reddit page for more information.
Source: Investopedia









