
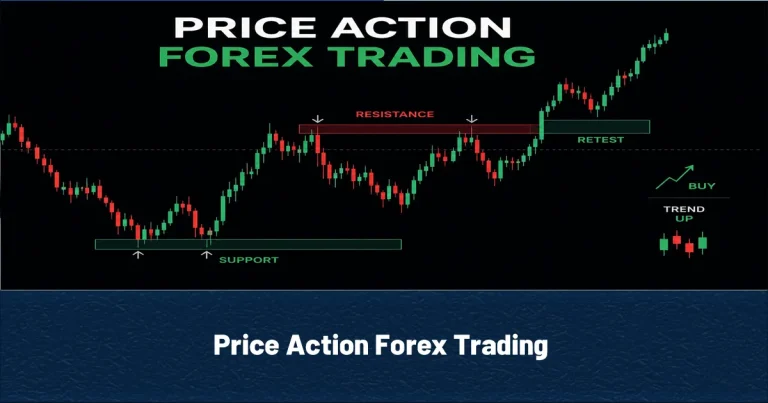
Price action forex trading is the practice of making all trading decisions based on the movement of price over time without relying on lagging indicators like MACD, Stochastic, or Bollinger Bands. The core idea is straightforward: everything relevant to the market — sentiment, liquidity, institutional positioning, and news impact — is already reflected in the price itself. A trader who learns to read that price correctly has all the information they need.
The three building blocks of every price action strategy are: support and resistance forex levels (where price has historically reversed or stalled), candlestick patterns trading (the individual bars that reveal who is in control — buyers or sellers), and market structure (the sequence of highs and lows that defines trend direction). Master these three, and every setup you trade becomes a logical expression of supply and demand, not a pattern memorized from a textbook.
Read More: XAUUSD Trading in 2026
The Role of Support and Resistance in Price Action
Support and resistance forex levels are the foundation on which every price action trade is built. Support is a price zone where buying pressure has historically been strong enough to halt or reverse a decline. Resistance is the opposite — a zone where selling pressure consistently caps upward moves.
These levels are not lines; they are zones, and their significance grows each time price tests and respects them. In 2026, with algorithmic trading accounting for the majority of forex order flow, support and resistance levels are more relevant than ever. Institutional algorithms are programmed to react at key levels — which means that the same zones retail traders identify on their charts are often the same zones where the largest orders are placed.
How to Identify High-Quality Levels
Not every previous high or low qualifies as a meaningful support and resistance forex level. The levels worth trading from share three characteristics:
- Clean tests: The level has been respected at least twice, with clear rejections — not slow, grinding price action through the zone.
- Visible on higher timeframes: A level visible on the H4 or daily chart carries more weight than one only visible on M15.
- Round number proximity: Levels near psychological round numbers (1.1000, 1.2500, 150.00) attract additional order flow and tend to produce sharper reactions.
Read More: AI Forex Trading in 2026
Candlestick Patterns Trading: Reading Each Bar as a Story
Candlestick patterns trading is the language price action traders use to interpret what happened during a specific period. Each candle tells a complete story: where price opened, how far it moved in both directions, and where it closed. That story reveals the balance of power between buyers and sellers in real time. The most reliable candlestick signals in forex are not the exotic multi-candle formations described in some trading books. They are simpler, more visible, and more consistently actionable. Focus on these:
- The Engulfing Candle: A bullish engulfing candle forms when a large up-candle completely “engulfs” the body of the preceding down-candle. When this appears at a significant support and resistance forex level, it signals that buyers have decisively overwhelmed sellers and a reversal may be underway. The bearish version — a large down-candle engulfing a preceding up-candle — signals the same dynamic in reverse at resistance.
- The Inside Bar: An inside bar is a candle whose high and low fall entirely within the range of the preceding candle. It represents a pause in momentum — a moment of indecision before the market chooses a direction. When an inside bar forms at a key level within a clear trend, a breakout in the direction of the trend is the highest-probability setup in candlestick patterns trading.
The Bullish Pin Bar: The Most Powerful Reversal Signal in Forex
Of all the patterns in candlestick patterns trading, the bullish pin bar forex is the most widely used and most extensively studied. A pin bar (short for “Pinocchio bar”) is characterized by a small body and a long wick — the wick representing a sharp rejection of price by the market. A bullish pin bar forex has a long lower wick, indicating that sellers drove price down sharply during the period, but buyers rejected that move and pushed price back up to close near the open.
When a bullish pin bar forex forms at a major support zone on an H4 or daily chart, it is one of the highest-probability entry signals available. The entry is typically placed just above the high of the pin bar; the stop loss below the wick low; the target at the next significant resistance level. The bearish equivalent — a pin bar with a long upper wick at resistance — works identically in reverse. Together, pin bars at key levels represent the clearest expression of support and resistance forex interacting with candlestick patterns trading: the level provides the context; the pin bar confirms the rejection.
Read More: Best Prop Trading Firms in 2026; The complete guide for funded traders
Price Action Forex Trading Setups: Quick Comparison
| Setup | Timeframe | Skill Level | Best Used When |
| Pin Bar Reversal | H1 / H4 / D1 | All levels | Reversals at key support/resistance; high R:R setups |
| Inside Bar Breakout | H4 / D1 | Intermediate | Consolidation phases before directional breakout |
| Support & Resistance | H1 / H4 / D1 | All levels | Range-bound markets; structural level bounces |
| Engulfing Candle | H4 / D1 | Beginner | Momentum reversals after extended trending moves |
| Market Structure Shifts | H4 / D1 | Intermediate | Trend changes; CHoCH and BOS identification |
Reading the Forex Price Action Trading Chart Correctly
A forex price action trading chart read correctly is a map of supply and demand over time. The mistake most beginners make is looking at a chart and seeing randomness — thousands of candles with no obvious pattern. The correction is to look at structure first, details second.
- Step 1 — Identify the Dominant Trend: On the daily chart, mark the sequence of highs and lows. Higher highs and higher lows = uptrend. Lower highs and lower lows = downtrend. This single observation on a forex price action trading chart eliminates the majority of low-probability counter-trend trades before you even look at an entry setup.
- Step 2 — Mark Key Support and Resistance Zones: Drop to the H4 chart and mark the two or three most significant support and resistance forex levels in the vicinity of current price. These become your trade locations — the zones where you will look for entry signals.
- Step 3 — Wait for a Confirming Candlestick Signal: When price reaches one of your marked levels, examine the candlestick patterns trading setup that forms there. A bullish pin bar forex at support, a bearish engulfing at resistance, an inside bar breakout in trend direction — these are the confirmations that price is ready to move. Without confirmation, there is no trade.
Read More: Forex Demo Account: Everything Beginners Should Know
Final Thoughts; Price Action Forex Trading
Price action forex trading is not a shortcut. It is a skill — one that takes months to develop to a tradeable standard and years to master. But the traders who invest in that development gain something no indicator can provide: the ability to read a forex price action trading chart in any market condition, on any pair, at any time, without depending on a system built by someone else.
Master support and resistance forex first. Then learn the key candlestick patterns trading setups — starting with the bullish pin bar forex and the engulfing candle. Build your entries around confluences: a strong level plus a confirming candle plus trend alignment. That framework, applied consistently with disciplined risk management, is the foundation of how professional traders have navigated the forex market for decades.
Read More: HYCM Review
Source of “Price Action Forex Trading” Article: Investopedia









