
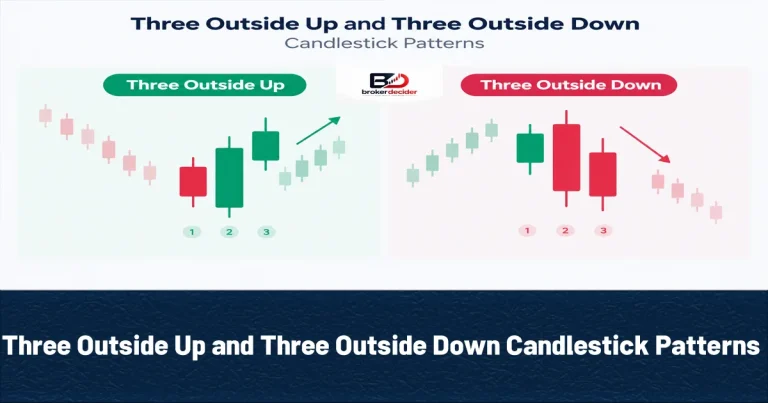
The Three Outside Up and Three Outside Down Candlestick Patterns are three candle reversal formations used in technical analysis to identify potential changes in market direction. Both patterns are based on an engulfing formation, with the third candle providing additional confirmation of the potential reversal. Three Outside Up generally appears after a downtrend and indicates that buying pressure may be increasing. Three Outside Down typically develops after an uptrend and suggests that sellers may be gaining control. While these patterns can provide useful information about price momentum, traders generally combine them with market structure and other technical signals rather than relying on the formation alone.
Three Outside Up and Three Outside Down Candlestick Patterns
At first, Three Outside Up will be explained and then, it will be Three Outside Down turn.
Three Outside Up
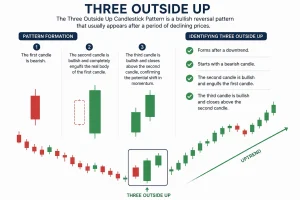
The Three Outside Up Candlestick Pattern is a bullish reversal pattern that usually appears after a period of declining prices. The formation contains three candles:
- The first candle is bearish.
- The second candle is bullish and completely engulfs the real body of the first candle.
- The third candle is bullish and closes above the second candle, confirming the potential shift in momentum.
Identifying Three Outside Up:
- Forms after a downtrend.
- Starts with a bearish candle.
- The second candle is bullish and engulfs the first candle.
- The third candle is bullish and closes above the second candle.
Three Outside Down
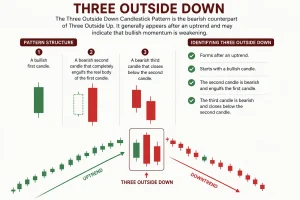
The Three Outside Down Candlestick Pattern is the bearish counterpart of Three Outside Up. It generally appears after an uptrend and may indicate that bullish momentum is weakening. Its structure includes:
- A bullish first candle.
- A bearish second candle that completely engulfs the real body of the first candle.
- A bearish third candle that closes below the second candle.
Identifying Three Outside Down:
- Forms after an uptrend.
- Starts with a bullish candle.
- The second candle is bearish and engulfs the first candle.
- The third candle is bearish and closes below the second candle.
Read More: What is Three Inside Up and Three Inside Down Candlestick Patterns? How to Use it?
Three Outside Up and Three Outside Down Comparison Table
In the below table, we will compare Three Outside Up and Three Outside Down with each other:
| Feature | Three Outside Up | Three Outside Down |
| Main signal | Increase in buying pressure | Increase in selling pressure |
| location | After a downtrend | After an uptrend |
| Direction | Bullish reversal | Bearish reversal |
| First candle | Bearish | Bullish |
| Second candle | Bullish engulfing | Bearish engulfing |
| Third candle | Bullish | Bearish |
Reading Three Outside Up and Three Outside Down Patterns
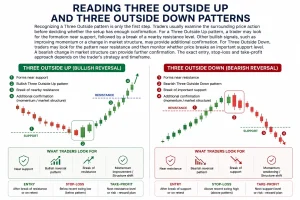
Recognizing a Three Outside pattern is only the first step. Traders usually examine the surrounding price action before deciding whether the setup has enough confirmation. For a Three Outside Up pattern, a trader may look for the formation near support, followed by a break of a nearby resistance level. Other bullish signals, such as improving momentum or a change in market structure, may provide additional confirmation. For Three Outside Down, traders may look for the pattern near resistance and then monitor whether price breaks an important support level. A bearish change in market structure can provide further confirmation. The exact entry, stop-loss and take-profit approach depends on the trader’s strategy and timeframe.
Read More: What is Tweezer Top and Tweezer Bottom Candlestick Patterns? How to Use it?
Support and Resistance and Three Outside Patterns
The location of a candlestick pattern is often as important as its structure. A Three Outside Up pattern appearing after a substantial decline and close to a well-established support zone may attract more attention because the market has already reached an area where buyers have previously shown interest. Conversely, a Three Outside Down formation near resistance can indicate that buyers are struggling to maintain upward momentum. However, support and resistance levels are zones rather than guaranteed turning points. Price can move through them, so confirmation remains important.
Engulfing and Three Outside Patterns Difference
The main difference is the additional confirmation provided by the third candle. A bullish or bearish Engulfing pattern consists of two candles. Three Outside Up and Three Outside Down add a third candle moving in the same direction as the potential reversal. Look at the lists below:
Bullish Engulfing with 2 Candles: The confirmation is in Second candle
Three Outside Up with 3 Candles: The confirmation is in Third bullish candle
——————————
Bearish Engulfing with 2 Candles: The confirmation is in Second candle
Three Outside Down with 3 Candles: The confirmation is in Third bearish candle
Read More: What is Dark Cloud Cover Candlestick Pattern? How to Use it?
Three Outside Up and Three Outside Down Patterns Limitations
Like other candlestick patterns, the Three Outside Up and Three Outside Down Candlestick Patterns do not guarantee a successful reversal. They can fail when the broader trend remains strong or when the market is moving sideways. Another consideration is that waiting for the third candle means the trader receives confirmation later in the formation. Part of the potential price movement may therefore have already occurred. For this reason, traders commonly combine candlestick analysis with market structure, support and resistance, volume, momentum indicators and risk management.
Conclusion About Three Outside Up and Three Outside
The Three Outside Up and Three Outside Down Candlestick Patterns provide a structured way to identify potential bullish and bearish reversals. Three Outside Up develops from a bearish-to-bullish sequence, while Three Outside Down represents the opposite transition. The patterns are particularly useful when their formation agrees with the broader market context. Rather than treating a three candle formation as an automatic entry signal, traders can use it as one piece of evidence when analyzing trend direction, price structure and key support or resistance levels.
Visit Broker Decider Reddit page for more information.
Source: Investopedia









