
The Best Forex Indicators and totally all indicators do not predict the future. They describe the past — sometimes very usefully, sometimes with a lag that makes them nearly irrelevant by the time they fire a signal. Every indicator you will ever use is derived from price data that has already happened.
The moving average does not know where price is going; it tells you where it has been. The RSI does not predict reversals; it describes momentum relative to recent history. Why does this matter? Because traders who expect indicators to generate reliable buy and sell signals on their own will always be disappointed. The ones who do well use indicators as confirmation tools — filters that add confidence to a decision that price structure has already suggested. That framing changes everything about how you use them.
Read More: Forex Copy Trading in 2026
Best Forex Indicators at a Glance
| Indicator | Type | Skill Level | Market Condition | Primary Use |
| 200 EMA | Trend | All | Trending | Primary trend filter |
| 50 EMA | Trend | All | Trending | Dynamic support/resistance in active trends |
| RSI | Momentum | All | Any | Overbought/oversold + divergence detection |
| MACD | Momentum | Intermediate | Any | Momentum shifts |
| Bollinger Bands | Volatility | Intermediate | Ranging | Squeeze breakouts |
| ATR | Volatility | All | Any | Stop loss sizing |
| OBV | Volume | Intermediate | Trending | Confirms breakouts |
The Best Forex Indicators by Category
Different indicators measure different things. Understanding which category an indicator belongs to — and therefore what question it answers — prevents the common mistake of stacking five indicators that all say the same thing in five different ways.
Read More: Forex Risk Management; The Complete Framework for Protecting Your Trading Capital
Trend Indicators: The 200 EMA and 50 EMA
If you only ever use one indicator, make it the 200-period Exponential Moving Average (200 EMA). It is the most widely watched level in professional forex trading — referenced by institutional desks, algorithmic systems, and retail traders alike. When price is above the 200 EMA, the market is in a structural uptrend. When it is below, a downtrend.
Simple, but the consistency with which price reacts to this level on daily and weekly charts makes it genuinely useful as a directional filter. The 50 EMA serves as a dynamic support and resistance level within a trend. In an uptrend, price regularly pulls back to the 50 EMA before continuing higher — a phenomenon visible on EUR/USD, GBP/USD, and XAUUSD across multiple years of data. Using the 50 EMA to time entries within a trend identified by the 200 EMA is one of the cleanest, most practical applications of moving averages in forex trading. Best used on H4 and daily charts. Less reliable on timeframes below H1 due to noise.
Momentum Indicators: RSI and MACD
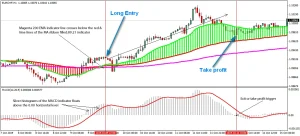
RSI (Relative Strength Index, default period 14) is the most broadly useful momentum indicator in forex. It oscillates between 0 and 100, with readings above 70 considered overbought and below 30 considered oversold. In strongly trending markets, these levels are less useful as reversal signals — price can remain overbought for extended periods.
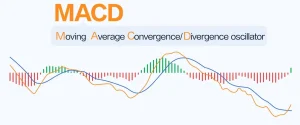
Where RSI genuinely earns its place is in divergence: when price makes a new high but RSI makes a lower high, the momentum behind the move is weakening. That divergence precedes many of the cleanest reversals in forex, particularly on H4 and daily charts. MACD — the Moving Average Convergence Divergence — measures the relationship between two EMAs and visualizes momentum through a histogram. Traders use it primarily for two signals: the crossover (when the MACD line crosses the signal line) and histogram expansion (increasing bar height = strengthening momentum). MACD is a lagging indicator by definition, so it is most useful for confirming momentum rather than timing entries precisely.
Read More: Best Forex Trading Strategies: A Practical Guide for Consistent Traders in 2026
Volatility Indicators: Bollinger Bands and ATR
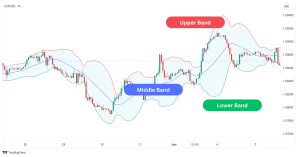
Bollinger Bands consist of a 20-period moving average flanked by two bands set two standard deviations above and below. When the bands contract, volatility is low and a significant directional move is often building. When price breaks out of the squeeze, the direction of that breakout — confirmed by momentum indicators — frequently produces a sustained trend move. This setup has been documented extensively across institutional and retail research and remains relevant in 2026.
ATR (Average True Range) is arguably the most practically useful indicator in this entire list — not because it generates trade signals, but because it answers the one question every trader needs to answer before entering a position: how much is this market typically moving? ATR is the foundation of intelligent stop loss placement and position sizing. A stop tighter than ×0.5 the daily ATR will be taken out by routine market noise. Every serious forex trader has ATR on their chart, even if they have nothing else.
Volume: On-Balance Volume (OBV)
Forex is a decentralized market, which means true volume data — the number of contracts changing hands — is not available the way it is in equities or futures. What forex platforms provide is tick volume: the number of price changes per period. This is not perfect, but multiple academic studies have confirmed that tick volume correlates meaningfully with real institutional volume, particularly on major pairs during active sessions.
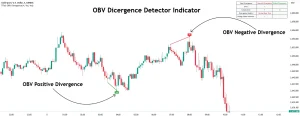
On-Balance Volume (OBV) accumulates this tick volume over time, rising when periods close up and falling when they close down. A breakout above a resistance level on expanding OBV is significantly more reliable than the same breakout on declining or flat volume. Volume does not generate entries on its own — it confirms or contradicts the signals price structure and other indicators produce.
Read More: Price Action Forex Trading
How to Combine Indicators Without Overloading Your Chart
The traders with the most cluttered charts are almost never the most profitable ones. Indicator overload does not improve analysis — it creates conflicting signals, analysis paralysis, and a false sense of preparation that substitutes for actual decision-making. A clean, functional setup uses one indicator from each relevant category:
- Trend direction: 200 EMA
- Momentum filter: RSI
- Risk sizing: ATR
- Optional add: 50 EMA and Bollinger Bands
Indicator Settings: Should You Change the Defaults?
This question comes up constantly, and the honest answer is: usually not. The default settings on RSI, MACD, ATR, and Bollinger Bands are defaults because decades of use by millions of traders have made them the most widely watched levels. When a level is watched by enough participants, it tends to become self-fulfilling — which is exactly the property you want from a technical indicator.
The one exception worth making is moving average periods. The 200 EMA and 50 EMA are standard. But some traders use 21 EMA, 100 EMA, or 190 EMA for specific strategies. If your strategy is built around a specific MA period that you have validated, use it. Just understand that the further you deviate from universally watched levels, the less your indicator reflects shared market reality — and the more it reflects your personal preference.
Read More: XAUUSD Trading in 2026
Conclusion: The Best Forex Indicators Are the Ones You Actually Understand
The best forex indicators are not the most sophisticated ones. They are the ones you understand well enough to apply consistently, to know when they work and when they do not, and to combine intelligently with price structure and risk management. A trader who has used the 200 EMA and RSI for two years will outperform someone running a ten-indicator system they half-understand — every time. Keep your chart clean. Know what each indicator is measuring and why. And when two of your tools conflict, default to price structure — because price is always the most honest indicator on the chart.
Source: Investopedia









