
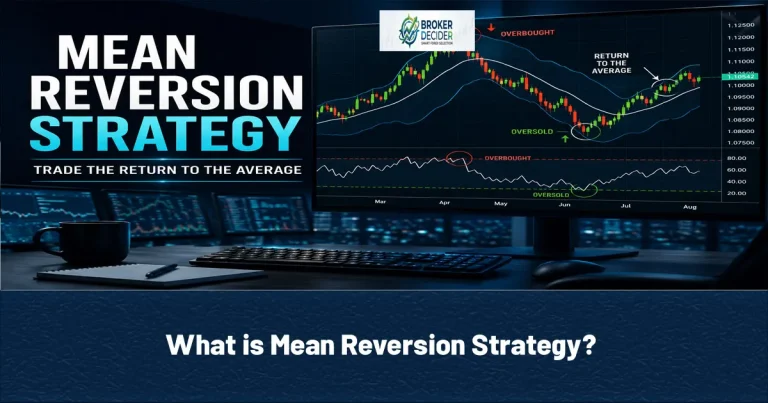
A mean reversion strategy trades on the idea that price tends to snap back toward its historical average after moving too far in one direction. Instead of riding an existing trend, mean reversion traders look for overextended moves and position for a return toward the average. A mean reversion strategy works best in range-bound or low-trending markets, and performs poorly in strong trends, where price can stay “overbought” or “oversold” far longer than expected.
What is Mean Reversion Strategy?
Markets rarely move in a straight line forever. Even inside a strong trend, price often gets temporarily overextended before correcting back toward some average value and that correction is what this strategy is built to capture. The “mean” is usually a statistical reference: a 20, 50, or 200-period moving average, a long-term equilibrium price, the middle Bollinger Band, or a historical trading range. The core assumption is that the farther price drifts from that average without real fundamental justification, the more likely it eventually snaps back, the opposite bet from trend following, which assumes momentum keeps going.
Why Mean Reversion Strategy Works?
Markets run on supply and demand, but short-term emotion regularly pushes price past what fundamentals justify. Panic selling drags price below fair value, excess optimism drags it well above. As emotion fades and new buyers or sellers step in, price tends to drift back toward equilibrium.
Where Mean Reversion Strategy Works Best?
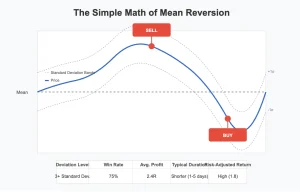
If the market condition is Sideways, Performance will be Excellent. For Low volatility market condition, the Performance will be Good. Also for Slow trending and Strong bull or bear trend, the Performance will be Moderate and weak.
EUR/USD chopping between 1.1650 and 1.1750 for two weeks gives repeated chances to buy near support and sell near resistance. But if it breaks above 1.1750 on a major ECB surprise and starts trending hard, fading every rally turns into a string of losses fast. Reading the environment correctly matters more than the strategy’s own rules.
Finding a Real Opportunity with Mean Reversion Strategy
Professional traders don’t enter just because price “looks too high”, they wait for objective evidence that are:
- Distance from a moving average: Gold trading around its 50-day average at $3,420, then spiking to $3,560 (about 4.1% above it), with momentum visibly slowing, is the kind of stretch traders watch for a pullback toward.
- Bollinger Bands: Bands expand and contract with volatility; a close outside the upper or lower band flags an extended move — but it needs price action, support/resistance, or momentum alongside it, not automatic action.
- RSI: Above 70 suggests overbought, below 30 oversold — neither guarantees a reversal. EUR/USD hitting RSI 76 after a fast rally is a cue to watch for bearish price action at resistance, not a reason to short immediately.
An Example of Mean Reversion Strategy
EUR/USD:
Range-bound between 1.1700 and 1.1800 for nearly three weeks. Price pokes to 1.1805, RSI climbs to 74, closes outside the upper Bollinger Band, and buying momentum fades. Entry 1.1798, stop 1.1835 (37 pips), target 1.1725 (73 pips) — roughly 1:2. The bet is a return toward the range’s middle, not a new downtrend.
Important Rules of Mean Reversion Strategy
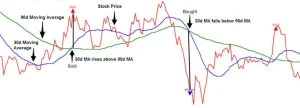
Trade only in range-bound markets: EUR/USD holding between 1.1700 support and 1.1800 resistance for three weeks is fair game for buying support and selling resistance. Once it breaks 1.1800 with real momentum after a major ECB announcement, the range is dead.
Wait for confirmation: Selling just because price “looks overbought” is one of the most expensive habits here. Real confirmation looks like rejection candles, engulfing patterns, momentum slowing at a key level, or multiple indicators agreeing.
Trade toward the mean, not a new trend: The target is the average — a 20-period moving average, the middle Bollinger Band, or the range’s center — not a fresh directional move. Gold dropping sharply from $3,520 to $3,430 on a panic wave targets a recovery to $3,475, where the 20-day average sits, not a new bull run.
Best Indicators for Mean Reversion Strategy
- RSI flags extremes (above 70 overbought, below 30 oversold) but shouldn’t trigger a trade alone. In strong trends it can sit at those levels for a long stretch without reversing.
- Bollinger Bands show deviation from the average; a close beyond either band signals possible overextension, and many wait for price back inside before acting.
- Moving averages (20 and 50-period) represent the mean itself — a big stretch from one without fundamental support is when reversal signals get taken seriously.
Entry and Exit Rules in Mean Reversion Strategy
EUR/USD ranging between 1.1680 and 1.1780, RSI at 73, price closing above the upper Bollinger Band, and a bearish engulfing candle at resistance: entry 1.1772, stop 1.1810 (38 pips), target 1.1705 (67 pips) — roughly 1:1.76, betting on a return to the range’s middle.
Using Mean Reversion Strategy is Prohibited in these Situations
Skip mean reversion when major events like NFP, CPI, or a central bank decision are driving a strong move; when price has broken a long-established range on rising volume; when a clear trend is confirmed by higher highs and higher lows (or the bearish mirror); or when volatility has just expanded sharply on unexpected news. In these cases, trend-following or breakout approaches fit better — markets can stay overbought or oversold far longer than a mean reversion trader can stay solvent.
Comparison: Mean Reversion and Trend Following
| Features | Mean Reversion | Trend Following |
| Description | Price returns to its average | Price continues in its direction |
| Typical entry | Near price extremes | After pullbacks or breakouts |
| Main risk | Trend continuation | Trend reversal |
| Best market | Sideways / range-bound | Strong trending |
Conclusion about Mean Reversion Strategy
Mean reversion works well when markets are genuinely range-bound and price has drifted unusually far from its average — but it depends on waiting for real evidence momentum is fading, not assuming every stretch snaps back. Combined with market structure, support and resistance, disciplined risk management, and confirmation from RSI or Bollinger Bands, it’s a solid tool for the right conditions. The limitation matters as much as the edge: in a strong, fundamentally driven trend, price can stay extended far longer than expected, and trend-following fits better there. Long-term results come from applying this strategy only when conditions actually favor it.
Source: Investopedia









