
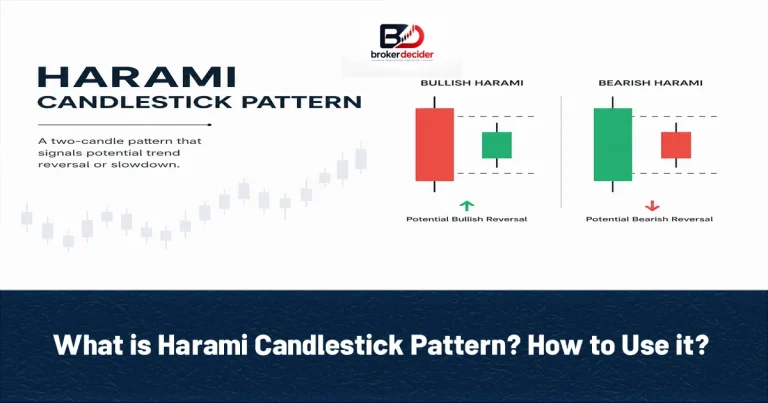
The Harami Candlestick Pattern is a two-candle formation that can signal a potential reversal or a slowdown in the prevailing trend. It appears when a relatively large first candle is followed by a smaller candle whose body forms within the range of the previous candle’s body. Traders commonly use the Harami pattern to identify possible shifts in market sentiment, particularly after a strong bullish or bearish move. However, the pattern is generally more useful when combined with price action, support and resistance levels, and technical indicators rather than used as a standalone trading signal.
Harami Candlestick Pattern
Harami Candlestick Pattern consists of two consecutive candlesticks. The first candle has a relatively large real body. The second candle has a smaller real body that is contained within the first candle’s body. The name Harami comes from a Japanese term associated with the concept of a pregnant woman, reflecting the visual appearance of the smaller candle inside the larger one. The pattern can be either bullish or bearish, depending on its position and candle structure.
Read More: What is Three Black Crows Candlestick Pattern? How to Use it?
Bullish Harami Candlestick
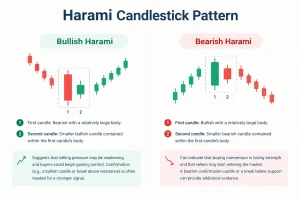
A Bullish Harami typically develops after a downward price movement. The first candle is generally bearish with a relatively large body. The second candle is smaller and forms within the body of the previous bearish candle. This structure suggests that selling pressure may be weakening and that buyers could begin gaining control. However, the appearance of a Bullish Harami does not guarantee an upward reversal. Traders often wait for confirmation, such as a subsequent bullish candle breaking above the pattern.
Bearish Harami Candlestick
A Bearish Harami generally appears after an upward price movement. The first candle is bullish and has a relatively large body, while the second candle is smaller and forms within the body of the preceding bullish candle. This can indicate that buying momentum is losing strength and that sellers may start entering the market. A bearish confirmation candle or a break below an important support level can provide additional evidence of a potential reversal.
Read More: What Is Three White Soldiers Candlestick Pattern? How to Trade It?
What is Harami Cross?
A variation of the Harami Candlestick Pattern is known as the Harami Cross. The main difference is the second candlestick. In a standard Harami, the second candle has a small real body. In a Harami Cross, the second candle is a Doji, meaning its opening and closing prices are very close. Because a Doji represents greater uncertainty between buyers and sellers, a Harami Cross can sometimes be interpreted as a stronger indication of market indecision.
Trading with Harami Candlestick Pattern
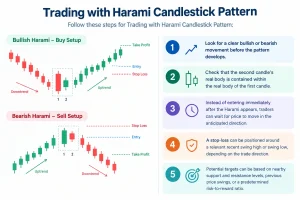
Follow these steps for Trading with Harami Candlestick Pattern:
- Step 1: Look for a clear bullish or bearish movement before the pattern develops.
- Step 2: Check that the second candle’s real body is contained within the real body of the first candle.
- Step 3: Instead of entering immediately after the Harami appears, traders can wait for price to move in the anticipated direction.
- Step 4: A stop-loss can be positioned around a relevant recent swing high or swing low, depending on the trade direction.
- Step 5: Potential targets can be based on nearby support and resistance levels, previous price swings, or a predetermined risk-to-reward ratio.
Read More: What Is Evening Star Candlestick Pattern? How to Trade It?
Harami Pattern for Forex Trading
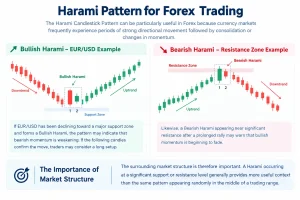
The Harami Candlestick Pattern can be particularly useful in Forex because currency markets frequently experience periods of strong directional movement followed by consolidation or changes in momentum. For example, if EUR/USD has been declining toward a major support zone and forms a Bullish Harami, the pattern may indicate that bearish momentum is weakening.
If the following candles confirm the move, traders may consider a long setup. Likewise, a Bearish Harami appearing near significant resistance after a prolonged rally may warn that bullish momentum is beginning to fade. The surrounding market structure is therefore important. A Harami occurring at a significant support or resistance level generally provides more useful context than the same pattern appearing randomly in the middle of a trading range.
Conclusion about Harami Candlestick Pattern
The Harami Candlestick Pattern is a two-candle formation that highlights a potential loss of momentum. A Bullish Harami can indicate weakening selling pressure after a decline, while a Bearish Harami can signal weakening buying pressure after an advance. The pattern is best treated as an early warning rather than a guaranteed reversal signal. Combining it with market structure and confirmation from subsequent price action can help traders make more informed decisions.
Visit Broker Decider Reddit page for more information.
Source: Investopedia









