
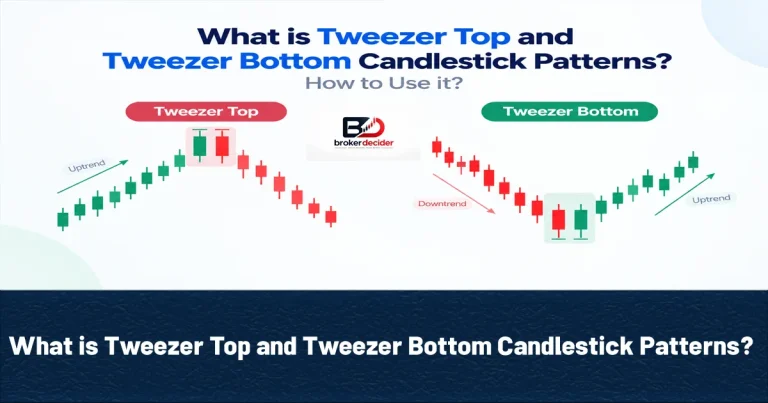
Tweezer Top and Tweezer Bottom Candlestick Patterns are two reversal formations that can help forex traders identify potential changes in market direction. They appear when consecutive candles form matching highs or lows, showing that the current trend may be losing momentum. Although these patterns can provide useful reversal signals, traders should confirm them with price action, trend context, and other technical indicators.
Tweezer Top and Tweezer Bottom Candlestick Patterns
Tweezer patterns usually consist of two consecutive candlesticks with similar or nearly identical extreme prices; Tweezer Top and Tweezer Bottom.
- Tweezer Top: Forms near the end of an uptrend and may signal a bearish reversal.
- Tweezer Bottom: Forms near the end of a downtrend and may signal a bullish reversal.
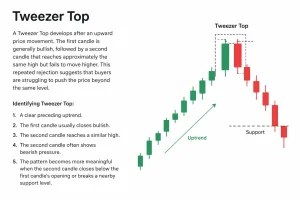
Tweezer Top
A Tweezer Top develops after an upward price movement. The first candle is generally bullish, followed by a second candle that reaches approximately the same high but fails to move higher. This repeated rejection suggests that buyers are struggling to push the price beyond the same level.
Identifying Tweezer Top:
- A clear preceding uptrend.
- The first candle usually closes bullish.
- The second candle reaches a similar high.
- The second candle often shows bearish pressure.
- The pattern becomes more meaningful when the second candle closes below the first candle’s opening or breaks a nearby support level.
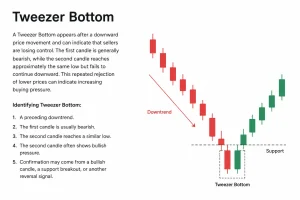
Tweezer Bottom
A Tweezer Bottom appears after a downward price movement and can indicate that sellers are losing control. The first candle is generally bearish, while the second candle reaches approximately the same low but fails to continue downward. This repeated rejection of lower prices can indicate increasing buying pressure.
Identifying Tweezer Bottom:
- A preceding downtrend.
- The first candle is usually bearish.
- The second candle reaches a similar low.
- The second candle often shows bullish pressure.
- Confirmation may come from a bullish candle, a support breakout, or another reversal signal.
Read More: What is Dark Cloud Cover Candlestick Pattern? How to Use it?
Tweezer Top and Tweezer Bottom Candlestick Patterns Comparison Table
| Feature | Tweezer Top | Tweezer Bottom |
| location | End of uptrend | End of downtrend |
| signal | Bearish reversal | Bullish reversal |
| Matching level | Similar highs | Similar lows |
| pressure | Buyers lose momentum | Sellers lose momentum |
| Confirmation | Bearish price action | Bullish price action |
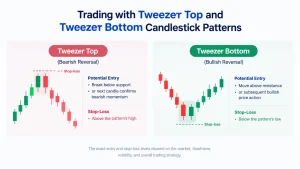
Trading with Tweezer Top and Tweezer Bottom Candlestick Patterns
The appearance of a Tweezer pattern should generally be treated as a potential reversal signal rather than an immediate trade entry. For a Tweezer Top, traders may wait for price to break below a nearby support level or for the next candle to confirm bearish momentum. A stop-loss can be considered above the pattern’s high. For a Tweezer Bottom, traders may wait for price to move above nearby resistance or for subsequent bullish price action. A stop-loss can be considered below the pattern’s low. The exact entry and stop-loss levels depend on the market, timeframe, volatility, and overall trading strategy.
Read More: What is Piercing Line Candlestick Pattern? How to Use it?
Tweezer Top and Tweezer Bottom Reliability
The reliability of Tweezer Top and Tweezer Bottom Candlestick Patterns depends heavily on context. A Tweezer pattern appearing after a strong trend and at a significant support or resistance area can be more informative than an isolated pattern in a sideways market. Traders can also look for confirmation from tools such as RSI, MACD, moving averages, volume, or market structure. A reversal signal supported by several independent factors is generally more useful than a candlestick pattern considered alone.
Final Thoughts About Tweezer Top and Tweezer Bottom
Tweezer Top and Tweezer Bottom Candlestick Patterns can help traders identify potential turning points in forex and other financial markets. Tweezer Top indicates possible bearish reversal pressure after an uptrend, while Tweezer Bottom can signal a potential bullish reversal after a downtrend. For better results, traders should combine these patterns with trend analysis, support and resistance, and confirmation from price action or technical indicators rather than relying on the pattern alone.
Read More: What is Harami Candlestick Pattern? How to Use it?
Visit Broker Decider Reddit page for more information.
Source: Investopedia









