
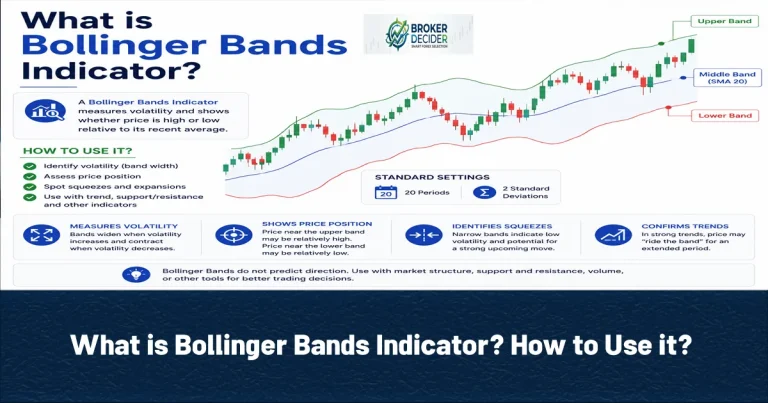
The Bollinger Bands Indicator measures market volatility and shows whether price is relatively high or low compared with its recent average. This Indicator has 3 lines:
- Middle Band: A 20-period simple moving average
- Upper Band: The middle band + two standard deviations
- Lower Band: The middle band – two standard deviations
The bands expand when volatility increases and contract when volatility decreases.
What is Bollinger Bands Indicator?
The Bollinger Bands Indicator was created by John Bollinger. Bollinger Bands adjust to changes in market volatility. When price movement becomes more volatile, the bands become wider. When the market becomes quieter, the bands move closer together. So we can say a key point is that Bollinger Bands primarily measure volatility, not trend direction.
Read More: What is MACD Indicator? How to Use it?
How the Bollinger Bands Works?
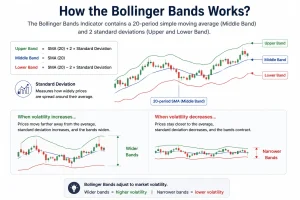
The Bollinger Bands Indicator contains A 20-period simple moving average (Middle Band) and 2 standard deviations (Upper and Lower Band). The upper and lower bands are calculated by adding or subtracting two standard deviations from that average. Standard deviation measures how widely prices are spread around their average. When recent prices move farther away from the average, standard deviation increases and the bands widen. When prices remain closer to the average, standard deviation decreases and the bands contract.
Bollinger Bands Formula
Middle Band=SMA(20)
Upper Band=Middle Band+2(Standard Deviation)
Lower Band=Middle Band−2(Standard Deviation)
Example of Bollinger Bands Calculation
Imagine that A 20-period simple moving average (SMA) is 1.1000 and 20-period standard deviation is 0.0050. So, the Bollinger Bands Calculation will be:
Middle Band=1.1000
Upper Band=1.1000 + (2 × 0.0050) = 1.1100
Lower Band=1.1000 − (2 × 0.0050) = 1.0900
Middle Band of Bollinger Bands Indicator
The middle band is a 20-period simple moving average. It can help traders evaluate the market’s short-term direction like this:
- Price above the middle band support bullish conditions
- Price below the middle band support bearish conditions
- Repeated reactions around the middle band may indicate a range or changing momentum.
Read More: What Is RSI Indicator? How Should We Use It?
Upper Band of Bollinger Bands Indicator
The upper band represents a relatively high price area based on recent volatility. When price reaches or moves above the upper band, it indicate:
- Strong bullish momentum
- Increasing volatility
- Extended move
- Possible continuation during a strong uptrend
Lower Band of Bollinger Bands Indicator
The lower band represents a relatively low price area based on recent volatility. When price reaches or moves below the lower band, it indicate:
- Strong bearish momentum
- Increasing volatility
- Extended decline
- Possible continuation during a strong downtrend
The width of the bands in Bollinger Bands Indicator
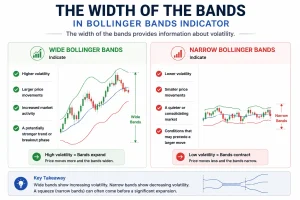
The width of the bands provides information about volatility:
- Wide Bollinger Bands indicate Higher volatility, Larger price movements, Increased market activity and A potentially stronger trend or breakout phase.
- Narrow Bollinger Bands indicate Lower volatility, Smaller price movements, A quieter or consolidating market and Conditions that may precede a larger move.
Read More: Best Forex Indicators in 2026
Price Behavior in Bollinger Bands Indicator
Price Behavior can have different Possible Interpretations in Bollinger Bands Indicator:
| Price Behavior in Bollinger Bands Indicator | Possible Interpretations |
| Price remains below the middle band | Bearish conditions may be developing or continuing |
| Price moves near the upper band | Strong bullish momentum or an extended move |
| Price returns toward the middle band | A pullback or mean-reversion phase may be developing |
| Price remains above the middle band | Bullish conditions may be developing or continuing |
| Price moves near the lower band | Strong bearish momentum or an extended decline |
| Price repeatedly moves between the outer bands | The market may be ranging |
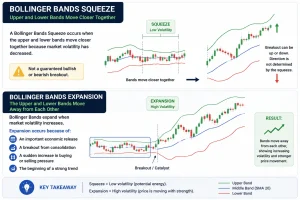
Bollinger Bands Squeeze; upper and lower bands move closer together
A Bollinger Bands Squeeze occurs when the upper and lower bands move closer together because market volatility has decreased (not a guaranteed bullish or bearish breakout).
Bollinger Bands Expansion: The upper and lower bands move away from each other
Bollinger Bands expand when market volatility increases. Expansion occur because of An important economic release, A breakout from consolidation, A sudden increase in buying or selling pressure and The beginning of a strong trend.
Read More: HYCM Broker Review
What is Walking the Band in strong trend?
During a strong trend, price may repeatedly move close to one of the outer bands. This behavior is sometimes called walking the band. In Bullish Band Walk, Price repeatedly closes near the upper band, Pullbacks are shallow, Price remains above the middle band and The upper band continues rising. In Bearish Band Walk, Price repeatedly closes near the lower band, Rallies are limited, Price remains below the middle band and The lower band continues falling.
Bullish Band Walk indicate persistent buying pressure
Bearish Band Walk indicate persistent selling pressure
Conclusion about Bollinger Bands Indicator
The Bollinger Bands Indicator uses a moving average and volatility based outer bands to show how price behaves relative to its recent range. The standard 20-period and 2-standard-deviation setting is a useful starting point, but it should not be treated as a complete trading system.
Source: Investopedia









