
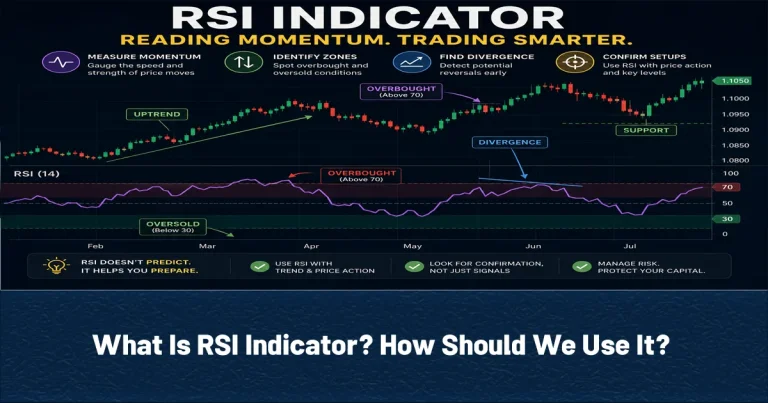
The RSI Indicator (Relative Strength Index) is a momentum oscillator that measures the speed and magnitude of recent price changes. RSI moves between 0 and 100 and is commonly used to identify strong momentum, potentially overbought conditions, potentially oversold conditions, and possible changes in market direction. Usual RSI settings are:
- period: 14
- Overbought level: 70
- Oversold level: 30
An Overbought level above 70 indicate strong recent upward momentum or a potentially overextended market. A reading below 30 may indicate strong recent downward momentum or a potentially oversold market.
RSI Indicator
The RSI Indicator was developed by J. Welles Wilder Jr. Unlike indicators that follow price directly, RSI measures the balance between recent gains and recent losses. It helps traders evaluate whether buying or selling pressure has been stronger during a selected period. The usual period for RSI indicator is 14. Look at the table below:
| No. | Time Frame | RSI Period Explanation |
| 1 | 1-hour chart | 14 hourly periods |
| 2 | 4-hour chart | 14 four-hour periods |
| 3 | Daily chart | 14 trading days |
How RSI Works?
RSI compares the average size of recent upward price changes with the average size of recent downward price changes. RS (relative strength) can be measured with the below formula:
RS (relative strength) = Average Gain ÷ Average Loss
In the above formula, A higher RS generally produces a higher RSI value and A lower RS generally produces a lower RSI value. For example, if the Average gain = 0.80 and Average loss = 0.40, RS (relative strength) = 2 (RS = 0.80 ÷ 0.40 = 2). So The RSI is approximately 66.7.
66.7 RSI indicates that recent upward price movement has been stronger than recent downward movement, although the reading is still below the traditional 70 overbought reference level.
RSI Indicator Interpretation
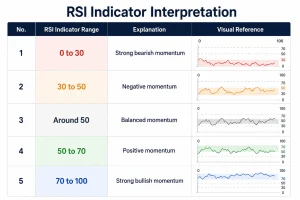
The amount of RSI Indicator can indicate a variety of things. Look at the table below:
| No. | The amount of RSI Indicator | Explanation |
| 1 | 0 to 30 | Strong bearish momentum |
| 2 | 30 to 50 | Negative momentum |
| 3 | Around 50 | Balanced momentum |
| 4 | 50 to 70 | Positive momentum |
| 5 | 70 to 100 | Strong bullish momentum |
Why RSI Indicator Midline (50) is important?
RSI Indicator Midline (50) is often used as a momentum reference. In a bullish market RSI may remain mostly above 50, Pullbacks may stop near the 40–50 area and A move back above 50 can support renewed bullish momentum. In a bearish market, RSI may remain mostly below 50, Rallies may fail near the 50–60 area and A move below 50 can support renewed bearish momentum. For instance, if GBP/USD is forming higher highs and higher lows while RSI repeatedly holds above 45 and returns above 50, the indicator may support the broader bullish structure.
Overbought and Oversold Levels in RSI Indicator
The most common use of the RSI Indicator is for identifying potentially overbought and oversold market conditions. An overbought market is not necessarily ready to fall, and an oversold market is not necessarily ready to rise. RSI shows the strength of recent price movement. It does not guarantee that momentum will reverse.
RSI Above 70; Overbought
An RSI reading above 70 indicates that recent upward price movement has been strong relative to recent downward movement. Possible interpretations include Strong bullish momentum, A potentially extended upward move, Increased risk of a pullback and A market that may require additional confirmation before a new long entry. For example, suppose EUR/USD rises from 1.0850 to 1.1020, while RSI moves from 55 to 76. The reading shows strong bullish momentum, but selling only because RSI is above 70 may be premature.
RSI Below 30; Oversold
An RSI reading below 30 indicates that recent downward movement has been strong. Possible interpretations include Strong bearish momentum, A potentially extended decline, Increased probability of a temporary rebound and A market that may need confirmation before a long trade. Assume GBP/USD falls from 1.2800 to 1.2600, and RSI drops to 24. Buying immediately may be risky if the market remains in a strong downtrend.
Best RSI Indicator Settings
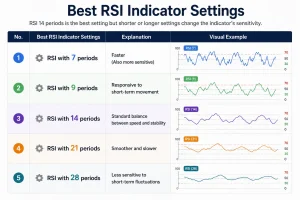
RSI 14 periods is the best setting but shorter or longer settings change the indicator’s sensitivity. Look at the table below:
| No. | Best RSI Indicator Settings | Explanation |
| 1 | RSI with 7 periods | Faster (Also more sensitive) |
| 2 | RSI with 9 periods | Responsive to short-term movement |
| 3 | RSI with 14 periods | Standard balance between speed and stability |
| 4 | RSI with 21 periods | Smoother and slower |
| 5 | RSI with 28 periods | Less sensitive to short-term fluctuations |
Divergence in RSI Indicator
RSI divergence occurs when price and RSI move in different directions. 2 kinds of divergence exist that are Bearish and Bullish. Bearish divergence may occur when Price forms a higher high or RSI forms a lower high. Also, Bullish divergence may occur when Price forms a lower low or RSI forms a higher low.
Entry Framework with RSI Indicator
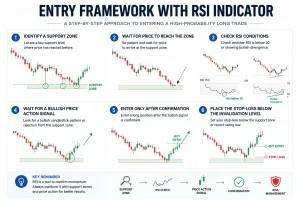
For entering a position with RSI Indicator, follow the steps below:
- Identify a support zone
- Wait for price to reach the zone.
- Check whether RSI is below 30 or showing bullish divergence
- Wait for a bullish price action signal
- Enter only after confirmation
- Place the stop-loss below the invalidation level
RSI Trading Strategies
You must not use RSI alone for getting trading signals. RSI works best in combination with other strategies and indicators. A practical RSI strategy combines the indicator with:
Conclusion about RSI Indicator
The RSI Indicator measures the speed and strength of recent price changes. RSI most common settings use a 14-period calculation with 70 and 30 as overbought and oversold reference levels.
Source of “What Is RSI Indicator? How Should We Use It?” Article: Investopedia









