
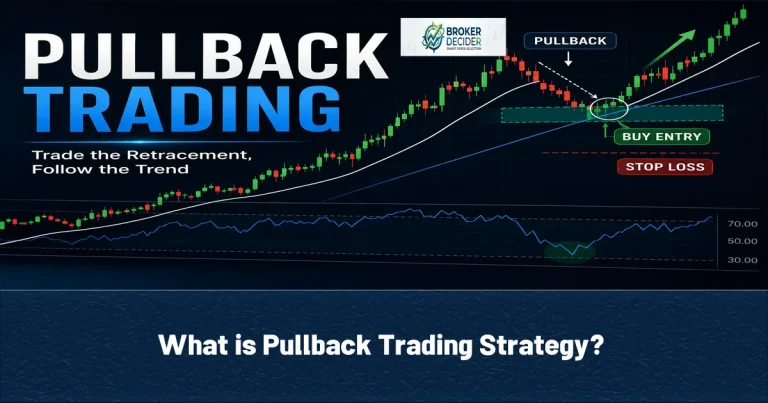
Pullback Trading is a strategy in which traders enter in the direction of an existing trend after price temporarily moves against that trend. In an uptrend, traders look for a short-term decline before buying. In a downtrend, they wait for a temporary rally before selling. The goal is not to catch the exact beginning of a trend. It is to enter after a retracement provides a better price, a clearer stop-loss level, and a more favorable risk-to-reward ratio. For example, if EUR/USD rises from 1.0800 to 1.1000, then retraces to 1.0920 before buyers return, the move from 1.1000 to 1.0920 may be a pullback rather than a bearish reversal.
What is Pullback Trading Strategy?
A pullback is a temporary price movement against the dominant trend (A pause or correction inside a trend).
- Pullback In a bullish market: 1. Price forms higher highs and higher lows. 2. Price temporarily declines. 3. Buyers return before the broader bullish structure is invalidated.
- Pullback In a bearish market: 1. Price forms lower highs and lower lows. 2. Price temporarily rises. 3. Sellers return before the broader bearish structure is invalidated.
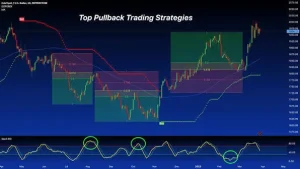
Difference between Pullback and Reversal
A pullback and a reversal can initially look similar because both move against the previous direction. The difference is whether the broader market structure remains intact.
| Feature | Reversal | Pullback |
| Main trend | Changes direction | Remains valid |
| Trading objective | Trade the new trend | Join the existing trend |
| Duration | Sustained | Temporary |
| Market structure | Breaks | Remains intact |
Example: GBP/USD is in an uptrend:
- Swing low: 1.2700
- Swing high: 1.2900
- New higher low: 1.2800
If price falls from 1.2900 to 1.2820 and buyers return, the decline may be a pullback. However, if price breaks below the important 1.2800 higher low and continues forming lower highs and lower lows, the market may be transitioning into a reversal. This distinction is critical because buying every decline without checking market structure can lead to entering after the trend has already changed.
Why Pullbacks Occur?
Pullbacks are a normal part of market behavior. Even strong trends rarely move in a straight line. Several factors can cause temporary retracements:
| No. | Why Pullbacks Occur? |
| 1 | Short-term buyers or sellers entering against the trend. |
| 2 | Temporary changes in liquidity. |
| 3 | Traders taking profits after a strong move. |
| 4 | Price revisiting a previous support or resistance level. |
| 5 | Market participants reassessing economic data. |
For example, Gold may rise from $3,300 to $3,420 and then decline to $3,375 as early buyers take profits. If the broader bullish structure remains intact and demand returns near support, the decline may represent a pullback rather than the beginning of a bearish trend.
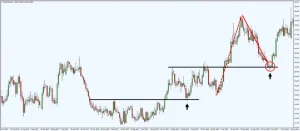
Identifying a Real Pullback
Follow these steps for Identifying a Real Pullback:
- Confirm the Primary Trend: Start with the higher timeframe. A bullish trend generally shows Higher highs or Higher lows. A bearish trend generally shows Lower highs or Lower lows. For example, a trader may use the daily chart to identify the main trend and the 4-hour chart to find a pullback entry. Trading in the direction of the higher-timeframe trend can reduce the risk of reacting to minor market noise.
- Identify a Meaningful Price Level: Pullbacks often return to areas where price previously reacted. Common levels include Previous resistance becoming support, Previous support becoming resistance, A major moving average, A trendline and A supply or demand zone. For example, EUR/USD breaks above 1.0950, then retraces to 1.0955. If the former resistance area holds as support, traders may look for bullish confirmation.
- Look for Evidence That the Pullback Is Ending: A pullback is not automatically a trade signal. Traders often wait for evidence that the main trend is resuming, such as A bullish or bearish engulfing candle, A rejection candle at support or resistance, A break of short-term market structure and Increasing momentum in the trend direction. Waiting for confirmation may produce a later entry, but it can reduce the risk of entering while the pullback is still developing.
- Check Whether the Trend Structure Remains Valid: If an uptrend continues to respect its previous higher low, the bullish structure may remain valid. If that level breaks decisively, the setup should be reassessed rather than treated as an automatic buying opportunity.
Pullback Trading Entry Rules
For entering a trading position using Pullback Trading Strategy, following these steps is mandatory:
| No. | Pullback Trading Process |
| 1 | Identify the primary trend on a higher timeframe. |
| 2 | Mark a meaningful level, such as previous support or resistance. |
| 3 | Wait for price to retrace toward that area. |
| 4 | Look for confirmation that the dominant trend is resuming. |
| 5 | Define the stop-loss and target before entering. |
For example, assume EUR/USD is bullish on the daily chart and has broken above 1.1000. Price later retraces to 1.1010, where the former resistance area begins acting as support. The trader does not buy immediately. They wait for a bullish rejection candle or a break above a short-term swing high. This provides evidence that buyers may be returning.
Suitable Tools for Pullback Trading
| Tools | Explanations | settings | Example |
| Moving Averages | Moving averages can help identify dynamic support and resistance during a trend. |
|
For example, if GBP/USD remains above a rising 50-period moving average and repeatedly finds buyers near it, the moving average may provide useful context for pullback entries. However, a moving average is not an automatic buy or sell signal. Price action and market structure should still confirm the setup. |
| Fibonacci Retracement | Some traders use Fibonacci levels to estimate where a pullback may slow. |
|
Suppose EUR/USD rises from 1.0800 to 1.1000, a total move of 200 pips. Approximate retracement levels would be: 38.2%: 1.0924, 50%: 1.0900 ,61.8%: 1.0876 |
Practical Example of Pullback Trading
Assume GBP/USD is in an established uptrend and the Market conditions are:
- Daily chart: Higher highs and higher lows.
- 4-hour chart: Price breaks above 1.2800.
- Price retraces to 1.2810.
- A bullish engulfing candle forms near the previous breakout level.
So Possible trade plan can be:
- Entry: 1.2830
- Stop Loss: 1.2780
- Risk: 50 pips
- Target: 1.2930
- Potential Reward: 100 pips
- Risk-to-Reward: 1:2
Stop-Loss and Profit Target in Pullback Trading
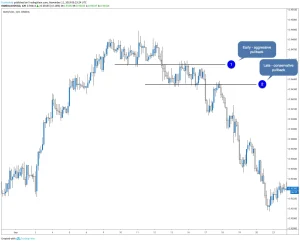
A stop-loss should be placed where the original trade idea is invalidated—not at an arbitrary number of pips. For a bullish pullback trade, traders often place the stop Below the pullback low, Below a key support level and Beyond the market structure level that must hold. For a bearish pullback trade, the stop is commonly placed Above the pullback high, Above key resistance and Beyond the swing level that invalidates the bearish setup.
Also, Common Setting for Profit Target include The previous swing high or swing low, A major support or resistance level, A fixed risk-to-reward ratio, such as 1:2 and A trailing stop if the trend remains strong.
Conclusion; Pullback Trading Strategy
Pullback Trading provides a structured way to enter an established trend without chasing price after a large move. The strongest setups usually combine a clear higher-timeframe trend, a meaningful support or resistance area, and evidence that the pullback is ending.
Source: Investopedia and CoinMarketCap









