

Market Structure (MS) is a pattern that price traces out as it moves through a sequence of highs and lows. Market Structure gives traders a way to judge whether buyers or sellers currently hold the upper hand. This article is about what Market Structure means, the three conditions every market moves through, how to read swing highs and swing lows, and how traders build it into a broader ICT Trading and Smart Money Concepts framework.
Market Structure Concept
Reading Market Structure ranks among the most valuable skills a trader can develop, since it provides context for nearly every decision made on the chart. Concepts like Break of Structure (BOS), Change of Character (CHOCH), Order Blocks, and Fair Value Gaps (FVG) all depend on a clear read of how price is forming its structure in the first place. Instead of asking where price might go next, traders who understand Market Structure start by analyzing what’s already there, letting the chart tell them what the market is currently communicating.
Why Market Structure (MS) is important?
Price rarely moves randomly for long stretches. Even in volatile conditions, it tends to follow recognizable patterns that reveal shifts in buying and selling pressure. A solid grasp of MS helps traders identify the current trend, avoid fighting against market momentum, improve trade timing, recognize possible reversals, filter out lower-quality setups, and build more consistent trading plans. Rather than leaning solely on indicators, many professional traders begin every chart analysis by first identifying the current Market Structure.
Types of MS
Types of MS are:
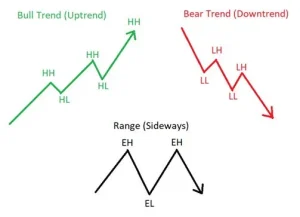
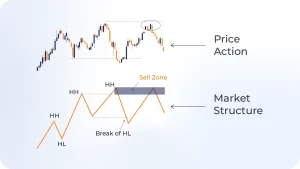
- Bullish Market Structure: It forms when price consistently prints Higher Highs (HH) and Higher Lows (HL). Each new buying wave pushes price above the previous high, while pullbacks stay above previous lows. This pattern suggests buyers remain firmly in control, and many traders look for buying opportunities as long as this structure stays intact.
- Bearish Market Structure: It forms when price prints Lower Highs (LH) and Lower Lows (LL). Each selling wave pushes price below prior lows, while rallies fail to reclaim previous highs. This tells traders that sellers currently dominate, and most avoid buying until the structure genuinely shifts.
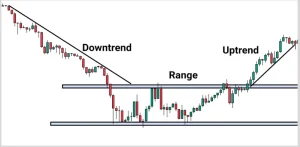
- Range-Bound Market Structure: Markets don’t trend all the time. Sometimes price simply moves sideways between support and resistance. During these stretches, Higher Highs stop forming, Lower Lows stop forming, and price repeatedly reverses inside a defined range. Range conditions typically call for a different trading approach than trending markets do.
What is Swing Highs and Swing Lows?
Every MS is built from swing highs and swing lows. A Swing High is a price peak flanked by lower highs on both sides, while a Swing Low is a price bottom flanked by higher lows on both sides. These turning points let traders judge whether price is strengthening, weakening, or simply consolidating, and learning to spot meaningful swing points is one of the foundations of price action analysis.
Identifying Market Structure
The steps of identifying MS are:
| Step 1 | Zoom Out | Start with a higher timeframe. Higher timeframes usually give a clearer picture of the dominant trend. |
| Step 2 | Mark Swing Highs and Swing Lows | Identify the major turning points rather than obsessing over every minor fluctuation |
| Step 3 | Determine the Trend | Ask a few simple questions: Are Higher Highs continuing? Are Higher Lows holding? Are Lower Highs forming? Are Lower Lows expanding? The answers reveal, in fairly plain terms, whether buyers or sellers currently have control. |
| Step 4 | Watch for Structural Changes | Keep an eye on events such as a Break of Structure, a Change of Character, or a liquidity sweep, since these often carry valuable information about how market conditions are evolving. |
Market Structure and ICT Trading
Within ICT Trading, MS acts as the foundation for nearly every trading decision. Rather than entering trades on indicators alone, ICT traders first work through a short mental checklist: which side currently controls the market, where liquidity is sitting, and whether structure is continuing or changing. Only after answering these questions do they start looking for an actual entry.
Market Structure and Smart Money Concepts
Smart Money Concepts build directly based on MS. Institutional traders are thought to accumulate positions during specific structural phases before driving larger directional moves. For that reason, SMC traders often combine Market Structure with liquidity, Order Blocks, Fair Value Gaps, Break of Structure, Change of Character, and premium and discount zones. The interaction between these concepts is what provides real context, rather than any single isolated signal.
Market Structure and Trend
Market Structure and Trend are sometimes used interchangeably but they aren’t quite the same thing. Look at the table below:
| Market Structure | Trend |
| Focuses on price behavior | Focuses on directional movement |
| Can reveal early structural shifts | Often becomes obvious only after the shift |
| Describes the arrangement of highs and lows | Describes the overall market direction |
| Forms the basis of price action analysis | Represents the outcome of the structure |
Common Mistakes of using Market Structure
Common Mistakes of using Market Structure are:
- Misidentifying swing points
- Ignoring higher timeframes
- Trading against the structure
- Ignoring market context
Advantages of Market Structure
The Advantages are:
- Supports better trade timing
- Works in every financial market
- Helps with risk management
- Fits with ICT Trading and Smart Money Concepts
- Doesn’t require technical indicators
- Improves overall trend analysis
disadvantage of Market Structure
Despite its usefulness, MS isn’t perfect. Different traders may interpret swing points differently, sideways markets often produce confusing signals, false breakouts still happen, lower timeframes carry more noise, and confirmation remains important before acting.
Final word about MS
Market Structure supplies the context behind every move the market makes. By understanding how highs and lows develop over time, traders can more reliably identify trends, spot potential reversals, and avoid fighting against the dominant market direction.
Source: CoinMarketCap









