
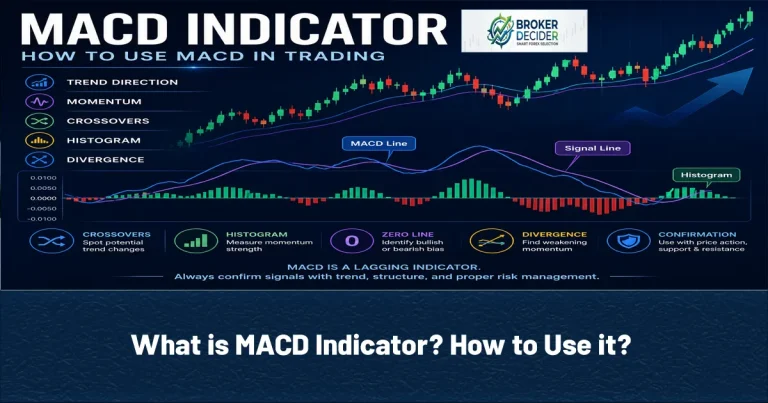
The MACD Indicator (Moving Average Convergence Divergence) used to analyze trend direction, momentum, and possible changes in market conditions. MACD is based on the relationship between two exponential moving averages (the 12-period EMA and the 26-period EMA). MACD also includes a 9-period Signal line and a Histogram that shows the distance between the MACD line and the Signal line.
Usual MACD settings:
- Fast EMA: 12 periods
- Slow EMA: 26 periods
- Signal line: 9 periods
Traders commonly use MACD to identify Bullish and bearish momentum, Potential trend changes, MACD line and Signal line crossovers, Movement above or below the zero line, Momentum strength through the Histogram and Bullish and bearish divergence. However, MACD is a lagging indicator because it is calculated from moving averages. A crossover may appear after price has already started moving. For this reason, MACD is generally more useful when combined with market structure, support and resistance, or price action.
MACD Indicator
The MACD Indicator was created by Gerald Appel. It was designed to show changes in momentum by measuring the relationship between two moving averages. The term Moving Average Convergence Divergence describes the way the two averages behave. Convergence occurs when the moving averages move closer together. Divergence occurs when the moving averages move farther apart. When the faster moving average rises above the slower moving average, bullish momentum may be increasing. When the faster moving average falls below the slower moving average, bearish momentum may be increasing.
Unlike RSI, which moves between 0 and 100, MACD has no fixed upper or lower limit. Its values depend on The asset’s price, The selected timeframe, Recent price movement and The distance between the two moving averages. For Instance, MACD values on USD/JPY may be very different from MACD values on XAU/USD. Traders generally focus more on the direction and relationship of the MACD components than on one specific numerical value.
MACD Calculation
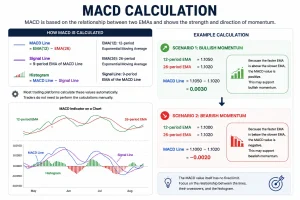
The MACD line is calculated by subtracting the 26-period EMA from the 12-period EMA. The Signal line is then calculated as a 9-period EMA of the MACD line. The Histogram shows the difference between the MACD line and the Signal line. Most trading platforms calculate these values automatically, so traders do not need to perform the calculations manually.
Example: Imagine that:
- 12-period EMA = 1.1050
- 26-period EMA = 1.1020
The MACD line would be: 1.1050 − 1.1020 = 0.0030
Because the faster EMA is above the slower EMA, the MACD value is positive. This may support bullish momentum. If the 12-period EMA later falls to 1.1000 while the 26-period EMA remains at 1.1020, the MACD value becomes: 1.1000 − 1.1020 = −0.0020. The negative value indicates that the faster EMA is below the slower EMA, which may support bearish momentum.
Components of MACD Indicator
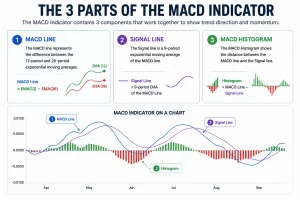
The MACD Indicator contains 3 parts:
- MACD Line: The MACD line represents the difference between the 12-period and 26-period exponential moving averages.
- Signal Line: The Signal line is a 9-period exponential moving average of the MACD line.
- MACD Histogram: he MACD Histogram shows the distance between the MACD line and the Signal line.
Interpretation of MACD Line
- MACD line rising: Increase in bullish momentum
- MACD line falling: Increase in bearish momentum
- MACD line above zero: The faster EMA is above the slower EMA
- MACD line below zero: The faster EMA is below the slower EMA
Interpretation of Signal Line
- MACD crossing above the Signal line: Increase in bullish momentum
- MACD crossing below the Signal line: Increase in bearish momentum
Interpretation of MACD Histogram
- Histogram bars expanding above zero: Strengthening in bullish momentum
- Histogram bars shrinking above zero: Weakening in bullish momentum
- Histogram bars expanding below zero: Strengthening in bearish momentum
- Histogram bars shrinking below zero: Weakening in bearish momentum
Reading MACD Indicator
- During an Uptrend and in a sustained bullish trend, the MACD line may remain above the Signal line, Both lines may remain above the zero line, The Histogram may stay positive for an extended period and Temporary pullbacks may produce short-term bearish crossovers. A bearish crossover during a strong uptrend does not always signal a full reversal. It may only reflect a temporary pullback.
- During a Downtrend and in a sustained bearish trend, the MACD line may remain below the Signal line, Both lines may remain below zero, The Histogram may remain negative and Short rallies may create temporary bullish crossovers.
- During a Range and in a sideways market, MACD may generate frequent crossovers as price moves back and forth. These signals can be less reliable because there is limited directional momentum. Traders may use support and resistance to determine whether a MACD signal has enough price context.
MACD Crossover
A MACD crossover occurs when the MACD line moves above or below the Signal line. MACD Crossover is divided in to 2 parts that are Bullish and Bearish. A bullish crossover occurs when the MACD line crosses above the Signal line, The Histogram moves from negative toward positive and Bullish momentum may be increasing. A bearish crossover occurs when The MACD line crosses below the Signal line, The Histogram moves from positive toward negative and Bearish momentum may be increasing.
Example of Bullish MACD crossover
| Point of MACD crossover | MACD Line | Signal Line |
| Before crossover | −0.0015 | −0.0010 |
| After crossover | −0.0007 | −0.0010 |
The MACD line is still below zero, but it has moved above the Signal line. This may indicate that bearish momentum is weakening and bullish momentum is beginning to develop. A bullish crossover below the zero line can occur early in a potential trend change, but it may also produce false signals.
Example of Bearish MACD crossover
| Point of MACD crossover | MACD Line | Signal Line |
| Before crossover | 0.0020 | 0.0015 |
| After crossover | 0.0012 | 0.0015 |
The MACD line remains above zero but has fallen below the Signal line. This may indicate that bullish momentum is weakening. A bearish crossover above zero may signal an early pullback rather than a complete trend reversal.
The MACD Indicator Zero Line
The zero line shows whether the fast EMA is above or below the slow EMA.
- MACD above zero: The 12-period EMA is above the 26-period EMA.
- MACD below zero: The 12-period EMA is below the 26-period EMA.
Bullish MACD Indicator Zero Line
A bullish zero line of MACD Indicator crossover occurs when the MACD line moves from below zero to above zero. Possible interpretations are The faster EMA has moved above the slower EMA, The broader momentum may be shifting upward and The signal may confirm an existing bullish move.
Bearish MACD Indicator Zero Line
A bearish zero line of MACD Indicator crossover occurs when the MACD line moves from above zero to below zero. Possible interpretations are The faster EMA has moved below the slower EMA, Downward momentum may be strengthening and The signal may confirm a bearish market structure.
Reading MACD Histogram
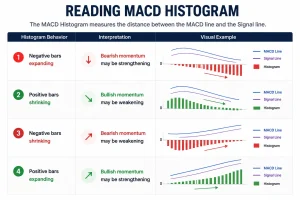
The MACD Indicator Histogram measures the distance between the MACD line and the Signal line. look at the table below for the interpretation of Histogram:
| Histogram Behavior | Interpretation |
| Negative bars expanding | Bearish momentum may be strengthening |
| Positive bars shrinking | Bullish momentum may be weakening |
| Negative bars shrinking | Bearish momentum may be weakening |
| Positive bars expanding | Bullish momentum may be strengthening |
What is MACD Divergence?
MACD divergence occurs when price and the MACD Indicator move in different directions. Bearish divergence may occur when Price forms a higher high or MACD forms a lower high. Also, Bullish divergence may occur when Price forms a lower low or MACD forms a higher low.
The Framework of MACD Entry
The Framework of MACD Entry is different based on bullish and bearish market. In a bullish setup, follow the steps below:
- Identify an uptrend
- Wait for a price pullback
- Check whether the MACD Histogram is becoming less negative
- Wait for the MACD line to cross above the Signal line
- Confirm with bullish price action
- Enter after confirmation
- Place the stop-loss below the invalidation level
A bearish setup uses the reverse process near resistance or within a downtrend.
Conclusion about MACD Indicator
The MACD Indicator helps traders analyze the relationship between trend direction and momentum through the MACD line, Signal line, Histogram, and zero line. The standard 12, 26, 9 settings provide a widely used balance between responsiveness and stability, but no setting is suitable for every market or strategy.
Source: Investopedia









