
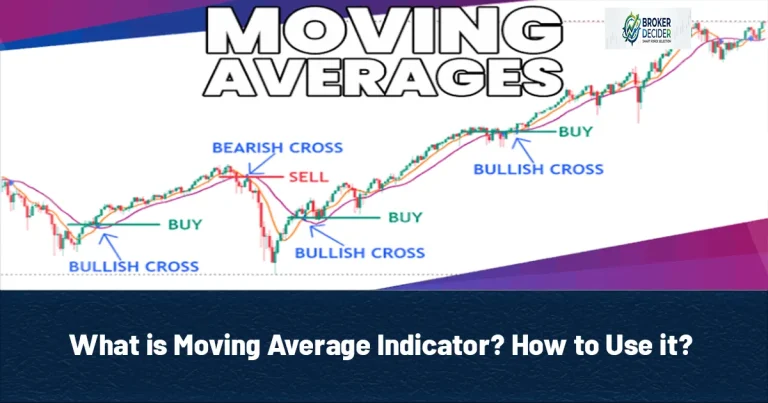
The Moving Average Indicator is one of the technical indicators for identifying market trends. It calculates the average price over a selected number of periods, creating a smooth line that helps traders filter short-term price fluctuations. The Moving Average Indicator has two types:
- Simple Moving Average (SMA): Calculates the average of closing prices over a selected period.
- Exponential Moving Average (EMA): Gives greater weight to recent prices, making it more responsive to market changes.
Why Traders Use the Moving Average Indicator?
Traders commonly use the Moving Average Indicator to:
- Identify trend direction
- Find dynamic support and resistance
- Confirm trend continuation
- Analyze moving average crossovers
- Filter market noise
How the Moving Average Indicator Works?
The Moving Average continuously recalculates itself as each new price is added. For example, a 20-period Moving Average always uses the most recent 20 price values. When a new candle closes, The newest closing price is added, The oldest price is removed, A new average is calculated and The Moving Average shifts forward. This creates a smooth line that follows price while reducing short-term volatility. A shorter Moving Average reacts more quickly to recent price changes. A longer Moving Average responds more slowly but provides a smoother representation of the overall trend.
Read More: What is Bollinger Bands Indicator? How to Use it?
The Moving Average Indicator types
Although several Moving Average variations exist, traders most commonly use Simple Moving Average (SMA) and Exponential Moving Average (EMA).
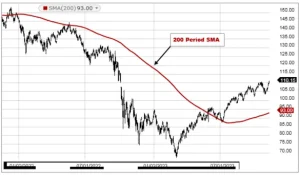
Simple Moving Average (SMA)
The Simple Moving Average calculates the arithmetic average of closing prices over a selected period. For example, a 5-period SMA adds the last five closing prices and divides the total by five. Suppose the last five closing prices are: 100, 102, 104, 103, 101. The calculation becomes:
(100 + 102 + 104 + 103 + 101) ÷ 5 = 102
Therefore, the 5-period SMA = 102. Because every price receives equal weight, SMA reacts more slowly to sudden market changes.
Exponential Moving Average (EMA)
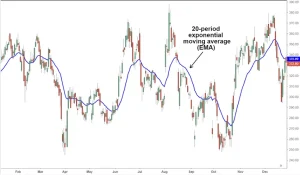
The Exponential Moving Average also calculates an average price, but it assigns greater weight to the most recent prices. As a result, EMA responds faster to changing market conditions. Rather than treating every price equally, EMA gradually reduces the influence of older prices while emphasizing recent market activity. For this reason, many short-term traders prefer EMA for Scalping, Day trading and Short-term swing trading. EMA can identify trend changes earlier than SMA, although it may also produce more false signals during choppy market conditions.
Read More: What is MACD Indicator? How to Use it?
Simple Moving Average (SMA) vs Exponential Moving Average (EMA)
| Simple Moving Average (SMA) | Exponential Moving Average (EMA) |
| Price weighting is Equal | Recent prices weighted more |
| Speed is Slower | Speed is Faster |
| Market noise is Lower | Market noise is Higher |
| Trend changes Later | Trend changes Earlier |
| Best suited for Long-term trend analysis | Best suited for Short-term trend analysis |
Moving Average Periods
Some of the Moving Average Periods are mor popular than the others:
- 9 EMA for Very short-term momentum
- 20 EMA/SMA for Short-term trend
- 50 SMA for Medium-term trend
- 100 SMA for Intermediate trend
- 200 SMA for Long-term trend
Reading the Moving Average Indicator
The Moving Average Indicator becomes more useful when traders evaluate its direction, slope, and relationship with price rather than focusing on a single crossover or touch. Instead of asking whether price is above or below the Moving Average, traders often analyze: The slope of the Moving Average, The distance between price and the Moving Average, The interaction between multiple Moving Averages and The overall market structure. The direction of the Moving Average provides a quick view of trend conditions:
- If Moving Average Behavior is Rising Possible Interpretation is Bullish trend may be strengthening.
- If Moving Average Behavior is Falling Possible Interpretation is Bearish trend may be strengthening.
- If Moving Average Behavior is Flat Possible Interpretation is Market may be ranging or losing momentum.
Read More: What Is RSI Indicator? How Should We Use It?
Dynamic Support and Resistance in the Moving Average Indicator
One of the most common uses of the Moving Average Indicator is identifying dynamic support and resistance. Unlike horizontal support or resistance, these levels change continuously as the Moving Average updates.
Dynamic Support
- Price remains above the Moving Average.
- Pullbacks approach the average.
- Buyers may return near the Moving Average.
- The trend resumes if support holds.
Dynamic Resistance
- Price remains below the Moving Average.
- Short-term rallies approach the average.
- Sellers may re-enter near the Moving Average.
- The downtrend continues if resistance holds.
Crossovers of Moving Average
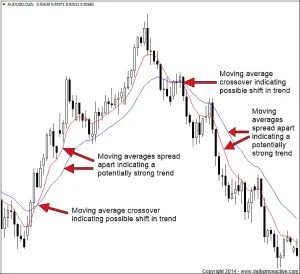
A Moving Average Crossover occurs when one Moving Average crosses another. Crossovers are commonly used to identify potential trend changes. A bullish crossover occurs when a shorter-period Moving Average crosses above a longer-period Moving Average. A bearish crossover occurs when the shorter Moving Average crosses below the longer Moving Average.
- Golden Cross: The Golden Cross is one of the most recognized Moving Average signals. It occurs when The 50-period Moving Average crosses above the 200-period Moving Average. Possible interpretations are Long-term momentum is improving, Buyers may be gaining control or A broader bullish trend could be developing. The Golden Cross often appears after price has already begun moving higher because both Moving Averages are based on historical prices. Therefore, it should be viewed as trend confirmation, not as an early prediction.
- Death Cross: The Death Cross is the opposite of the Golden Cross. It occurs when The 50-period Moving Average crosses below the 200-period Moving Average. Possible interpretations are Long-term bearish momentum may be increasing, Selling pressure may be strengthening or The broader trend may be shifting lower. Like the Golden Cross, the Death Cross is also a lagging signal and should not be used in isolation.
Read More: Best Forex Indicators in 2026
Conclusion about he Moving Average Indicator
The Moving Average Indicator is one of the simplest and most widely used tools for identifying market trends. Whether using SMA or EMA, the indicator helps smooth price fluctuations and provides valuable context about trend direction, dynamic support and resistance, and momentum.
Source: Investopedia









