
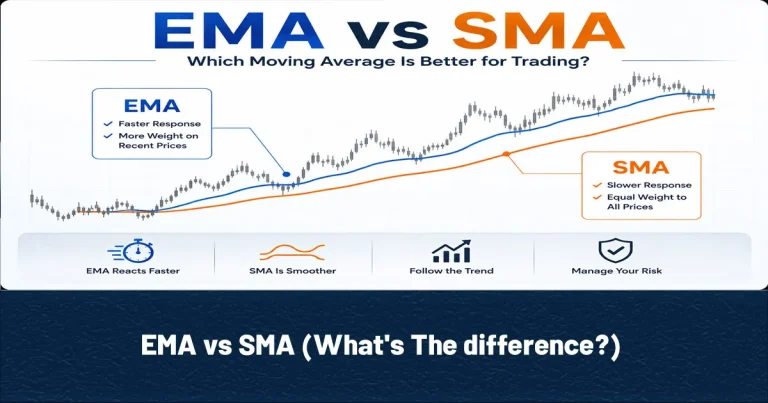
The difference between EMA vs SMA is that, a Simple Moving Average (SMA) gives equal weight to every price but an Exponential Moving Average (EMA) gives greater weight to more recent prices. So:
| SMA | Equal weight | Smoother response |
| EMA | Greater weight on recent prices | Faster response |
EMA vs SMA
Both EMA and SMA calculate an average price in a a specific periods. The difference is the weight dedicated to each price. In SMA we have an Equal weight. For example, If the closing prices of 5 pervious moving averages are 100, 102, 104, 103, 101, The SMA treats all five prices equally and the result is 102.
The EMA, however, gives more importance to the latest prices. The exact EMA value depends on the previous EMA and the smoothing factor, but the key principle is that the most recent price has a greater influence on the result. This difference becomes particularly important when the market experiences a sudden price movement.
SMA Calculation
SMA Calculation is easy. The only thing that is needed is adding the selected prices together and divide them to the number of the prices. For example, For a 20-period SMA, the closing prices of the most recent 20 candles are added together and divided by 20. When a new candle appears, the oldest observation leaves the calculation and the newest one enters it. This is why the Moving Average continuously moves with the market. Look at another example below:
- Period 1: 100
- Period 2: 103
- Period 3: 104
- Period 4: 103
- Period 5: 101
- SMA = 100+103+104+103+101 = 102.2
EMA Calculation
The Exponential Moving Average also calculates an average, but it gives greater weight to recent price data. This means a new price can have a more significant effect on the EMA than an older price from the same calculation period. The formula for EMA Calculation is:
EMAt=(Pt×α)+(EMAt−1×(1−α))
In the above formula, α is calculated with the below formula:
α=2/n+1
In these 2 formulas:
- EMAₜ = Current EMA
- Pₜ = Current price
- EMAₜ₋₁ = Previous EMA
- α = Smoothing factor
- n = number of periods
For example, for 20 periods, α is:
α = 2/20+1 = 0.0952
So, If the current price is 110 and the pervious EMA is 105 and we use 20 EMA, EMAt is:
EMAt = (110*0.0952) + (105 * 1-0.0952) = 10.472 + 94.999 = 105.47
EMA vs SMA; EMA React Faster
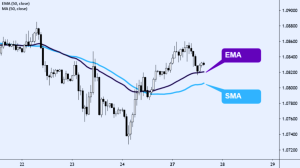
Imagine that a market has been moving sideways around 100 for several periods. Suddenly, price jumps to 110. The SMA will incorporate the new price into its average, but the older prices still receive exactly the same weight. The EMA gives the new 110 price greater influence. Therefore: SMA Changes more gradually EMA Adjusts more quickly.
EMA vs SMA; Market Volatility
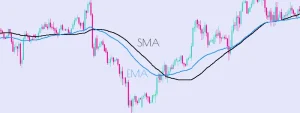
When Price Rises Quickly, The EMA generally moves toward price faster than the SMA. This can help traders identify developing momentum earlier. When Price Falls Quickly, The EMA also moves downward faster than the SMA. This may help traders detect weakening momentum or a potential trend change sooner. During Choppy Markets, The greater sensitivity of EMA can become a disadvantage. Small price movements may cause the EMA to change direction more frequently, potentially creating more false signals. The SMA tends to filter some of this short-term noise because it treats all observations equally.
EMA vs SMA for Different Strategies
| Strategies | EMA or SMA | Explanation |
| Scalping | EMA | Scalpers typically focus on very short-term price movements, so responsiveness can be particularly important. For this reason, some scalpers prefer 9 EMA and 20 EMA. The faster response can help traders identify short-term momentum changes. |
| Day Trading | EMA and SMA | For day trading, both EMA and SMA can be useful. A trader might use 9 EMA for short-term momentum, 20 EMA for the immediate trend and 50 SMA for broader intraday context. For example, if price is above the 20 EMA and the 20 EMA is rising, the short-term trend may be bullish. |
| Swing Trading | EMA and SMA | Swing traders generally hold positions for several days or weeks. A 20 EMA can help identify shorter-term pullbacks, while a 50 SMA can provide broader trend context. |
| Long-Term Trading | SMA | For long-term analysis, traders and investors often pay attention to longer-period SMAs such as the 100 SMA and 200 SMA. The 200 SMA is particularly useful for evaluating broad market trends because it responds relatively slowly to short-term price fluctuations. |
Comprehensive Comparison; EMA vs SMA
| Features | SMA | EMA |
| Price weighting | Equal | Greater weight on recent prices |
| Smoothness | Higher | Lower |
| Market noise | lower | Higher |
| Response speed | Slower | Faster |
| False signals in choppy markets | Can be fewer | Can be more frequent |
| Short-term trading | Less responsive | Often preferred |
| Short-term movements | Filters more | Reacts faster |
| Sensitivity | Lower | Higher |
| Reaction to sudden price changes | Slower | Faster |
| Long-term trend analysis | Commonly used | Also applicable |
Conclusion about EMA vs SMA
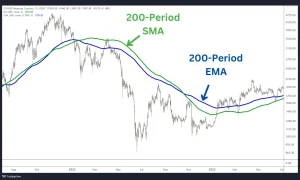
The EMA vs SMA comparison is about comes down to responsiveness versus smoothness. EMA Reacts faster, Emphasizes recent prices, Useful for short-term momentum and Can generate more noise. On the other hand, SMA Reacts more slowly, Gives equal weight to selected prices, Provides a smoother trend view and Can reduce some short-term fluctuations.
Source: Investopedia









