
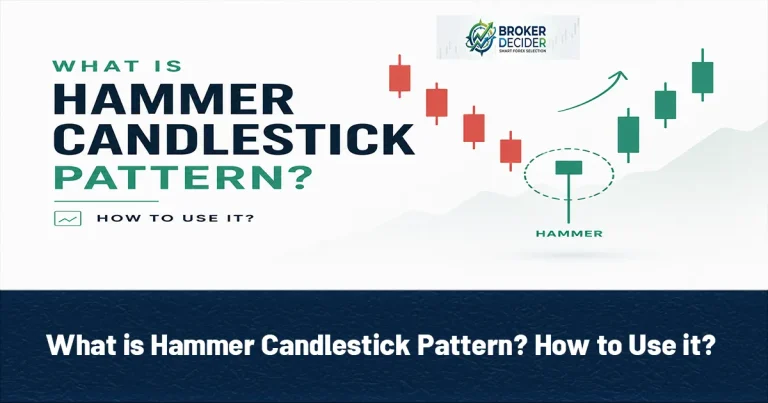
The Hammer Candlestick Pattern is one of the reversal patterns in technical analysis. It usually appears after a period of falling prices and can signal that sellers are losing control while buyers are beginning to come in. Its location, market trend, and confirmation candle are important when evaluating its reliability.
Hammer Candlestick Pattern
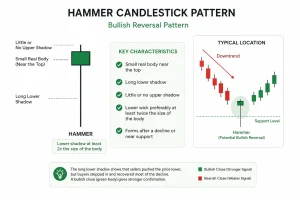
A Hammer Candlestick Pattern is a bullish reversal candlestick that usually forms near the end of a downtrend. It has a small real body positioned near the upper part of the candle and a long lower shadow. The lower wick typically shows that sellers pushed the price significantly lower during the session, but buyers managed to recover much of the decline before the candle closed. A classic Hammer has:
- A small real body near the top of the candle
- A long lower shadow
- Little or no upper shadow
- A lower wick preferably at least twice the size of the body
- A location following a decline or near support
The candle can be bullish or bearish, although a bullish close generally provides stronger evidence that buyers regained control.
Read More: What is Doji Candle? How to Use it?
Hammer Candlestick Pattern Formation
The formation of a Hammer tells a simple story about market behavior. At the beginning of the period, sellers remain in control and push the price lower. This creates the long lower shadow. However, as the session develops, buyers enter the market and drive the price back toward the opening level. The result is a candle with a relatively small body and a long lower wick. This rejection of lower prices is what makes the pattern interesting. It suggests that the market attempted to continue downward but encountered buying pressure.
Hammer vs Inverted Hammer Pattern
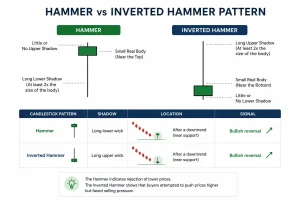
The Hammer and Inverted Hammer can look similar but have an important structural difference. A Hammer has a long lower shadow, while an Inverted Hammer has a long upper shadow.
| Candlestick Pattern | Shadow | Location | Signal |
| Hammer | Long lower wick | After a downtrend | Bullish reversal |
| Inverted Hammer | Long upper wick | After a downtrend | bullish reversal |
The Hammer indicates rejection of lower prices, while the Inverted Hammer shows that buyers attempted to push prices higher but faced selling pressure.
Reliable Hammer Candlestick Pattern
The location of the Hammer is more important than its shape alone. A Hammer forming in the middle of a strong downtrend without any additional confirmation may not mean much. In contrast, a Hammer appearing around a significant support level, previous swing low, trend line, or demand zone can carry more weight. For example, if EUR/USD declines toward an established support area and then forms a Hammer with a long lower wick, the candle may indicate that sellers were unable to maintain control at that price level. The broader market structure should always be considered before entering a trade.
Read More: What is Engulfing Pattern? How to Use it?
Trading with Hammer Candlestick Pattern
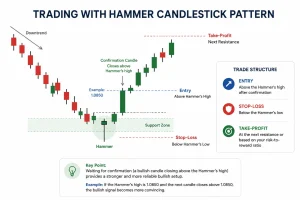
A conservative approach is to wait for confirmation rather than buying immediately after the Hammer forms. Suppose a Hammer develops near support during a downtrend. A trader could consider the following structure:
- Entry: Above the Hammer’s high after confirmation
- Stop-loss: Below the Hammer’s low
- Take-profit: At the next resistance or according to a predefined risk-to-reward ratio
A stronger confirmation may come from a subsequent bullish candle that closes above the Hammer’s high. For instance, if the Hammer reaches a high of 1.0850 and the next candle breaks and closes above that level, the bullish setup becomes more convincing than simply buying when the Hammer first appears.
Support and Resistance and Hammer Candlestick Pattern
Support and resistance can significantly improve the context of a Hammer. Imagine that GBP/USD has repeatedly bounced from a specific support zone. Price returns to that area and forms a Hammer after several bearish candles. The long lower wick shows that the market rejected prices below the support area. If buyers then push price above the Hammer’s high, traders may interpret this as confirmation of a potential bullish reversal. The same concept can be applied to stocks, indices, commodities, and cryptocurrencies.
Hammer Candlestick Pattern and Volume
Volume can provide additional information when it is available. A Hammer accompanied by noticeably higher trading volume may suggest stronger participation during the rejection of lower prices. This does not guarantee a reversal, but it can make the setup more interesting when combined with strong technical levels. In markets where reliable volume data is unavailable, traders should avoid treating volume as a mandatory confirmation tool.
Read More: What is ADX Indicator? How to Use it?
Final Thoughts about Hammer Pattern
The Hammer Candlestick Pattern can be a useful tool for identifying potential bullish reversals, especially when it forms after a decline and near an important support level. Its long lower shadow represents rejection of lower prices, while the small body shows that buyers managed to recover much of the earlier selling pressure. For better results, traders should combine the Hammer with market structure, support and resistance, volume, and confirmation from subsequent price action rather than using the candle in isolation. A disciplined entry, logical stop-loss, and predefined risk management are equally important. When these elements align, the Hammer becomes more than just a candlestick shape; it becomes part of a structured trading setup.
Source: Investopedia









