
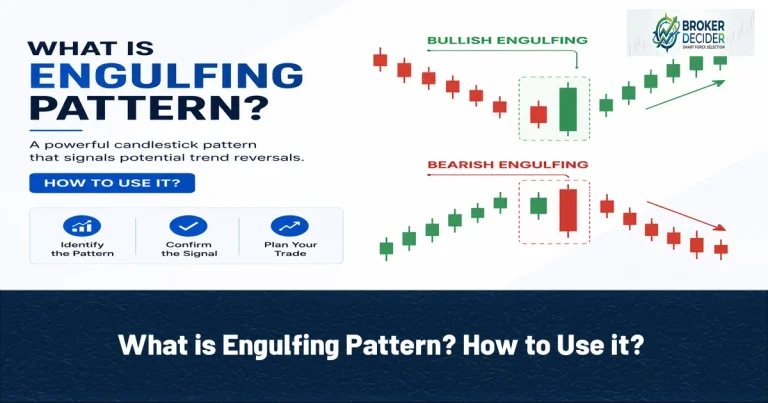
The Engulfing Pattern is a candlestick pattern that traders look for it when price reaches an important support or resistance level and begins to show signs of a reversal. An Engulfing Pattern is formed by two consecutive candles. The second candle becomes the key part of the setup because its real body completely covers the real body of the previous candle. Bullish Engulfing Pattern and Bearish Engulfing Pattern are two main types of Engulfing Patterns. Both can provide useful information about a potential change in market direction, but their reliability depends heavily on where and how they appear on the chart.
Engulfing Pattern
In an Engulfing Pattern 2 candle formation exist. Usually the body of the second candle completely engulfs the body of the first candle.
The pattern indicates that control between buyers and sellers may be shifting. For example, in a Bullish Engulfing Pattern, the market initially shows selling pressure. A bearish candle forms first, followed by a larger bullish candle whose body covers the previous bearish candle’s body. This suggests that buyers have entered the market strongly enough to overcome the earlier selling pressure. The opposite happens with a Bearish Engulfing Pattern. A bullish candle appears first, followed by a larger bearish candle that engulfs the previous bullish candle’s body. This can indicate that sellers are taking control.
Bullish Engulfing Pattern
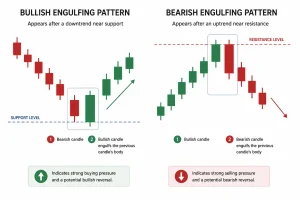
A Bullish Engulfing usually appears after a decline or near an important support area. The formation consists of two candles:
- The first candle is bearish.
- The second candle is bullish and has a real body that completely covers the real body of the previous candle.
The larger bullish candle shows that buying pressure has increased significantly. For example, suppose EUR/USD has been falling toward a major support level. Sellers remain in control and create a bearish candle. On the following candle, buyers enter aggressively and push price higher, producing a large bullish candle that engulfs the previous candle’s body. This creates a potential bullish reversal signal. However, the signal becomes more meaningful when the pattern forms at a well-defined support level rather than randomly in the middle of a trend.
Bearish Engulfing Pattern
A Bearish Engulfing is essentially the opposite of the bullish version. It commonly appears after an upward movement or near a resistance area. The formation contains:
- The first candle is bullish.
- The second candle is bearish and its real body completely covers the previous bullish candle’s body.
The second candle demonstrates that sellers have entered the market with enough strength to overcome the previous buying pressure. For example, if XAU/USD has been rising toward a significant resistance level, a bullish candle may form first. If the next candle opens near the previous close and sellers push price sharply lower, creating a large bearish body that engulfs the previous bullish body, a Bearish Engulfing Pattern appears. This can warn traders that the upward move may be losing momentum.
Bullish Engulfing vs Bearish Engulfing
| Features | Bullish Engulfing | Bearish Engulfing |
| First candle | Bearish | Bullish |
| Second candle | Bullish | Bearish |
| Location | After a decline | After an advance |
| Indication | bullish reversal | bearish reversal |
| Market pressure | Buyers gain control | Sellers gain control |
| Important level | Support | Resistance |
Identifying an Engulfing Pattern
For Identifying an Engulfing, follow these steps:
- Look at the Previous Candle: Start by examining the first candle. For a Bullish Engulfing Pattern, the first candle should generally be bearish. For a Bearish Engulfing Pattern, the first candle should generally be bullish.
- Check the Second Candle: The second candle should move in the opposite direction and have a significantly larger real body. The most important characteristic is that its real body engulfs the real body of the previous candle. The candle’s shadows do not necessarily have to be engulfed.
- Consider the Market Context: Do not evaluate the pattern in isolation. Ask where the pattern has formed.
Trade with the Engulfing
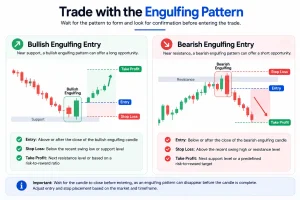
In trading with the Engulfing Pattern, usually wait for the pattern to form and then look for confirmation before entering. For example:
Bullish Engulfing Entry
Suppose price is approaching support and forms a Bullish Engulfing Pattern. A trader may consider a long position after the bullish candle closes. A basic structure could be:
- Entry: Above or after the close of the bullish engulfing candle
- Stop Loss: Below the recent swing low or support level
- Take Profit: Next resistance level or based on a predefined risk-to-reward ratio
Waiting for the candle to close is important because an engulfing formation can disappear before the candle is complete.
Bearish Engulfing Entry
For a Bearish Engulfing near resistance, a trader may consider a short position after the bearish candle closes. A basic setup could be:
- Entry: Below or after the close of the bearish engulfing candle
- Stop Loss: Above the recent swing high or resistance level
- Take Profit: Next support level or a predefined risk-to-reward target
The exact entry and stop placement should be adapted to the market and timeframe being traded.
Engulfing Pattern and Support and Resistance
One of the most useful ways to trade an Engulfing is to combine it with support and resistance. Consider a market that has been declining toward a support zone. If a Bullish Engulfing Pattern forms directly at that level, the pattern provides additional evidence that sellers may be losing control. The same principle applies to resistance. If price reaches resistance and forms a Bearish Engulfing Pattern, the setup may suggest that buyers are struggling to push price higher. This is why experienced traders generally pay more attention to where the pattern forms than simply whether the two-candle formation exists.
Engulfing Pattern and Trend
he relationship between the pattern and the broader trend also matters. A Bullish Engulfing Pattern during a downtrend can potentially signal a reversal or a temporary correction. A Bullish Engulfing Pattern during an established uptrend may instead represent a continuation after a pullback. The same applies to Bearish Engulfing Patterns. Therefore, traders should avoid assuming that every engulfing formation represents a complete trend reversal.
How to Confirm Engulfing Pattern?
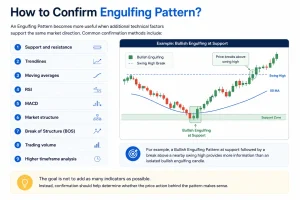
An Engulfing becomes more useful when additional technical factors support the same market direction. Common confirmation methods include:
- Support and resistance
- Trendlines
- Moving averages
- RSI
- MACD
- Market structure
- Break of Structure (BOS)
- Trading volume
- Higher timeframe analysis
For example, a Bullish Engulfing Pattern at support followed by a break above a nearby swing high provides more information than an isolated bullish engulfing candle. The goal is not to add as many indicators as possible. Instead, confirmation should help determine whether the price action behind the pattern makes sense.
Engulfing and Timeframes
Engulfing can appear on almost any timeframe, from very short-term charts to daily and weekly charts. However, the significance of a pattern can differ depending on the timeframe. Patterns on higher timeframes generally represent a larger amount of market activity and can provide stronger contextual information. For example, a Bullish Engulfing Pattern on a daily chart at major support may be more significant than a similar formation on a five-minute chart. Shorter timeframes can still be useful for day traders and scalpers, but they usually contain more market noise and false signals.
Final Thoughts about Engulfing
The Engulfing is one of the simplest candlestick formations to recognize, but using it effectively requires more than identifying two candles. A Bullish Engulfing Pattern can indicate increasing buying pressure, while a Bearish Engulfing Pattern can signal increasing selling pressure. Their significance becomes greater when they appear around important support and resistance levels and align with the broader market structure.
Source: Investopedia









