
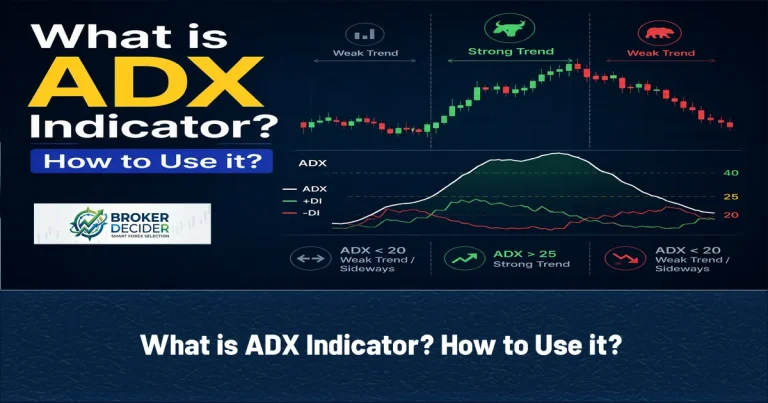
ADX Indicator can be used for measuring the strength of a market trend. Unlike indicators such as RSI or Stochastic Oscillator, ADX does not measure whether price is overbought or oversold. One of the most important characteristics of the ADX Indicator is that it measures trend strength rather than trend direction. For example, a rising ADX can occur during both a strong bullish trend and a strong bearish trend. To understand the direction, traders commonly analyze the +DI and -DI lines alongside ADX.
ADX Indicator
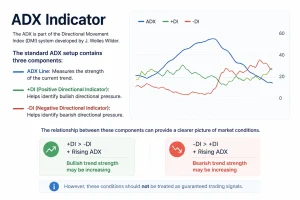
The ADX is part of the Directional Movement Index (DMI) system developed by J. Welles Wilder.
The standard ADX setup contains three components:
- ADX Line: Measures the strength of the current trend.
- +DI (Positive Directional Indicator): Helps identify bullish directional pressure.
- -DI (Negative Directional Indicator): Helps identify bearish directional pressure.
The relationship between these components can provide a clearer picture of market conditions. For example:
+DI > -DI + Rising ADX → Bullish trend strength may be increasing
-DI > +DI + Rising ADX → Bearish trend strength may be increasing
However, these conditions should not be treated as guaranteed trading signals.
ADX Indicator Performance
ADX is derived from True Range (TR) and directional movement.
The calculation generally follows several steps:
- Calculate True Range (TR).
- Calculate Positive Directional Movement (+DM).
- Calculate Negative Directional Movement (-DM).
- Smooth these values using Wilder’s smoothing method.
- Calculate +DI and -DI.
- Calculate the Directional Index (DX).
- Smooth DX to obtain the ADX.
The basic directional indicator calculations can be expressed as:
+DI = (+DM ÷ TR) × 100
-DI = (-DM ÷ TR) × 100
The difference between +DI and -DI is then used to calculate DX:
DX = |+DI − -DI| ÷ (+DI + -DI) × 100
ADX is subsequently derived by smoothing the DX values.
ADX 14
The commonly used setting is ADX 14, which means the standard calculation uses 14 periods. Different settings can change the indicator’s sensitivity:
- ADX 7: Faster and more sensitive
- ADX 10: More responsive
- ADX 14: Common standard setting
- ADX 21: Smoother
- ADX 28: Less sensitive to short-term changes
A shorter period can detect changes in trend strength more quickly, but it may also produce more fluctuations. A longer period provides a smoother reading but can react more slowly.
Read More: What is ATR Indicator? How to Use it?
Example of ADX Calculation
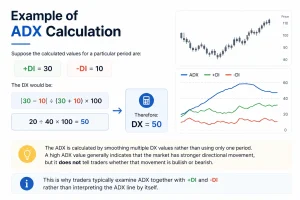
Suppose the calculated values for a particular period are:
- +DI = 30
- -DI = 10
The DX would be:
|30 − 10| ÷ (30 + 10) × 100
20 ÷ 40 × 100 = 50
Therefore:
DX = 50
The ADX is calculated by smoothing multiple DX values rather than using only one period. A high ADX value generally indicates that the market has stronger directional movement, but it does not tell traders whether that movement is bullish or bearish. This is why traders typically examine ADX together with +DI and -DI rather than interpreting the ADX line by itself.
Reading ADX Indicator
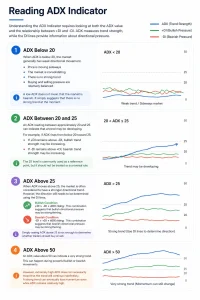
Understanding the ADX Indicator requires looking at both the ADX value and the relationship between +DI and -DI. ADX measures trend strength, while the DI lines provide information about directional pressure.
ADX Below 20
When ADX is below 20, the market generally has weak directional movement.
This can occur when:
- Price is moving sideways
- The market is consolidating
- There is no strong trend
- Buying and selling pressure are relatively balanced
A low ADX does not mean that the market is bearish. It simply suggests that there is no strong trend at the moment.
ADX Between 20 and 25
An ADX reading between approximately 20 and 25 can indicate that a trend may be developing. For example, if ADX rises from below 20 toward 25 while +DI remains above -DI, bullish trend strength may be increasing. Likewise, if -DI remains above +DI, bearish trend strength may be increasing. The 25 level is commonly used as a reference point, but it should not be treated as a universal rule.
ADX Above 25
When ADX moves above 25, the market is often considered to have a stronger directional trend. However, the direction still needs to be determined using the DI lines.
- Bullish Condition: +DI > -DI + ADX rising: This combination suggests that bullish directional pressure may be strengthening.
- Bearish Condition: -DI > +DI + ADX rising: This combination suggests that bearish directional pressure may be strengthening.
Therefore, simply seeing ADX above 25 is not enough to determine whether traders should buy or sell.
ADX Above 50
An ADX value above 50 can indicate a very strong trend. This can happen during powerful bullish or bearish movements. However, extremely high ADX does not necessarily mean that the trend will continue indefinitely. A strong trend can eventually lose momentum even while ADX remains relatively high.
Read More: What is VWAP Indicator? How to Use it?
Rising ADX vs Falling ADX
The direction of the ADX line can provide additional information.
- Rising ADX → Trend strength may be increasing
- Falling ADX → Trend strength may be decreasing
For example, if price is trending upward, +DI is above -DI, and ADX rises from 18 to 30, the market may be developing stronger bullish momentum. If ADX later begins falling, it may indicate that the strength of the trend is weakening, although price can continue moving in the same direction.
+DI and -DI
The relationship between the two DI lines is important when determining directional pressure.
| Condition | Interpretation |
| +DI > -DI | Bullish pressure may be stronger |
| -DI > +DI | Bearish pressure may be stronger |
| +DI crosses above -DI | Potential bullish shift |
| -DI crosses above +DI | Potential bearish shift |
| ADX rising | Trend strength increasing |
| ADX falling | Trend strength decreasing |
Read More: EMA vs SMA (What’s The difference?)
ADX in Trending and Ranging Markets
The ADX Indicator can be particularly useful for distinguishing between trending and non-trending conditions. In a strong trend, ADX may rise as directional movement becomes more pronounced. In a ranging market, ADX often remains relatively low because neither buyers nor sellers have established strong directional control. For this reason, traders may use ADX as a trend filter before applying a trend-following strategy. For example:
- ADX below 20 → Avoid trend-following setups
- ADX above 25 + clear DI direction → Consider trend-following setups
Trading Strategy of ADX
A practical ADX Trading Strategy should use the indicator as a trend-strength filter, rather than treating ADX as a standalone buy or sell signal. A simple framework is:
Identify Market Structure → Check ADX → Confirm +DI/-DI → Find Entry Zone → Confirm Price Action → Enter → Manage Risk
ADX and Support and Resistance
ADX can be combined with important support and resistance zones. For example, imagine that EUR/USD is in an uptrend and price pulls back toward a previous support level. If:
- ADX remains above 25
- +DI remains above -DI
- Price reacts positively at support
- Bullish price action appears
The setup may provide stronger evidence for potential trend continuation. The same concept can be applied to bearish trades around resistance.
Read More: What is Bollinger Bands Indicator? How to Use it?
Price Action and ADX
Price action can help confirm whether the directional pressure indicated by the DI lines is actually supported by market behavior. Potential confirmation signals include:
- Breakout from consolidation
- Higher highs and higher lows
- Lower highs and lower lows
- Rejection candles
- Break of a previous swing level
For example:
ADX rising + +DI above -DI + Break above resistance
May indicate strengthening bullish conditions. However, traders should still consider whether the breakout is genuine or a false breakout.
Stop-Loss and Take-Profit in ADX Indicator
ADX Indicator does not determine where a stop-loss should be placed. A better approach is to use market structure and invalidation levels. For a bullish trade, the stop-loss can be positioned below a meaningful Swing Low or support zone. For a bearish trade, it can be positioned above a relevant Swing High or resistance zone. Potential take-profit areas include:
- Previous Swing High or Low
- Major support or resistance
- A predefined risk-to-reward ratio
- Trailing stop based on market structure
The position size should be adjusted so that the distance to the stop-loss remains consistent with the trader’s predefined risk.
Read More: What is MACD Indicator? How to Use it?
Conclusion about ADX Indicator
The ADX Indicator is primarily a tool for measuring trend strength, not predicting market direction. Rather than using ADX as an automatic entry signal, traders can use it to determine whether market conditions are suitable for a trend-following strategy.
Source: Investopedia









