
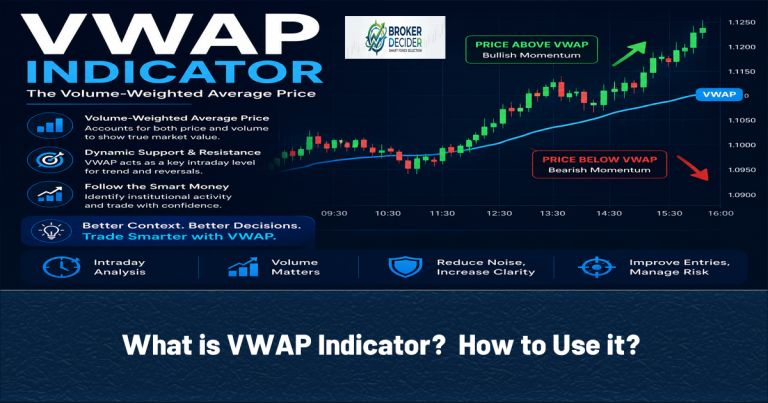
The VWAP Indicator (Volume Weighted Average Price) shows the average price an asset has traded at during a specific period. This Indicator gives a greater importance to prices traded with higher volume. Unlike a traditional Moving Average, VWAP considers both price and volume. VWAP is particularly popular for intraday trading because it can help traders evaluate whether the current market price is trading above or below the session’s volume-weighted average price. In VWAP Indicator:
- Price tells us where the market traded.
- Volume tells us how much trading activity occurred at those prices.
How to Calculate VWAP?
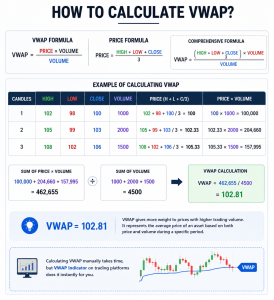
The formula for calculating VWAP is:
VWAP = price * volume / volume
In the above formula, the first volume in the red color is the trading volume of each candle and the second volume in blue color is the sum of all trading volume in a specific period. Finally, the price in the formula can be calculated with the below formula:
Price = High + Low + Close/3
So we can say that the comprehensive formula of VWAP is like this:
VWAP = ((High + Low + Close/3) * volume)/volume
Example of calculating VWAP
Imagine that we have the 3 candles below:
| Candles | High | Low | Close | volume |
| 1 | 102 | 98 | 100 | 1000 |
| 2 | 105 | 99 | 103 | 2000 |
| 3 | 108 | 102 | 106 | 1500 |
In the above example, the price (High + Low + Close/3) for each candle is:
price of candle 1: 102 + 98 + 100 / 3 = 100
price of candle 2 : 105 + 99 + 103 / 3= 102.33
price of candle 3: 108 + 102 + 106 / 3 = 105.33
So, price * volume for each candle is:
100 * 1000 = 100,000
102.33 * 2000 = 204,660
105.33 * 1500 = 157,995
Now that we have the price * volume for each candle, calculation of VWAP is easy:
VWAP= (100,000 + 204,660 + 157,995) / (1000 + 2000 + 1500)
462,655 / 4500 = 102.81
So:
VWAP= 102.81
As you see, calculating VWAP is not hard but it takes time. However, you don’t need to be worry. VWAP Indicator can calculate the amount of VWAP immediately and Instantly.
Read More: EMA vs SMA (What’s The difference?)
Different between VWAP and Moving Average
Both VWAP and Moving Averages can create a reference line on a price chart, but they calculate that line differently. Look at the table below to understand the difference completely:
| Features | VWAP | Moving Averages |
| Volume | Included | Not included |
| Common application | Intraday trading | Trend analysis |
| Session reset | Yes | No |
| Weighting | Volume weighted | SMA: Equal / EMA: Recent prices weighted |
| Price data | Yes | Yes |
Reading the VWAP Indicator
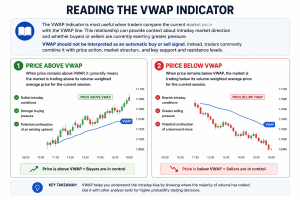
The VWAP Indicator is most useful when traders compare the current market price with the VWAP line. This relationship can provide context about intraday market direction and whether buyers or sellers are currently exerting greater pressure. VWAP should not be interpreted as an automatic buy or sell signal. Instead, traders commonly combine it with price action, market structure, and key support and resistance levels. Lets go to the interpretation of VWAP Indicator:
- Price Above VWAP: When price remains above VWAP, it generally means the market is trading above its volume-weighted average price for the current session. This can indicate Bullish intraday conditions, Stronger buying pressure or Potential continuation of an existing uptrend.
- Price Below VWAP: When price remains below VWAP, the market is trading below its volume-weighted average price. This may indicate Bearish intraday conditions, Greater selling pressure or Potential continuation of a downward move.
Read More: What is Bollinger Bands Indicator? How to Use it?
VWAP: Dynamic Support and Resistance
VWAP can be use as a Dynamic Support and Resistance:
- Support VWAP: During an intraday uptrend, price may repeatedly pull back toward VWAP before buyers regain control. A potential bullish setup could involve 1. Price moves above VWAP, 2. The market establishes a bullish structure, 3. Price pulls back toward VWAP, 4. VWAP coincides with a previous support zone, 5. A bullish rejection candle appears and 6. Price moves higher after confirmation. In this situation, VWAP provides additional context rather than being the sole reason for entering a trade.
- Resistance VWAP: During a bearish session, VWAP can sometimes act as dynamic resistance. A possible bearish setup occurs when 1. Price remains below VWAP, 2. The market forms lower highs and lower lows, 3. Price rallies toward VWAP, 4. Sellers appear near the VWAP area, 5. A bearish price-action signal develops and 6.Price resumes the downward move. The setup becomes more meaningful when VWAP aligns with another technical level.
Slope of VWAP
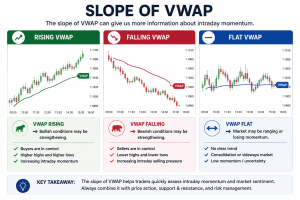
The slope of VWAP can give us more information about intraday momentum. If VWAP rise, bullish conditions may be strengthening, If VWAP fall, bearish conditions may be strengthening and If VWAP remain flat market may be ranging or losing momentum.
Read More: What is MACD Indicator? How to Use it?
Pullback Strategy of VWAP
A VWAP pullback strategy looks for price to return toward VWAP during an established trend.
In Bullish Setup:
- Price moves above VWAP.
- VWAP begins to slope upward.
- The market forms higher highs and higher lows.
- Price pulls back toward VWAP.
- VWAP aligns with a support level.
- A bullish rejection or continuation candle appears.
- Entry occurs after confirmation.
In Bearish Setup:
- Price remains below VWAP.
- VWAP slopes downward.
- Lower highs and lower lows are forming.
- Price rallies toward VWAP.
- VWAP aligns with resistance.
- A bearish rejection appears.
- Entry occurs after confirmation.
The stop-loss should be placed below the level that invalidates the bullish setup rather than simply a fixed distance below VWAP.
Read More: What Is RSI Indicator? How Should We Use It?
VWAP Breakout Strategy
VWAP can also be incorporated into breakout trading. A potential bullish setup may occur when:
- Price consolidates below or around VWAP.
- A clear resistance level develops.
- Price breaks above resistance.
- Price moves above VWAP.
- VWAP begins rising.
- The breakout receives confirmation from price action.
A bearish setup follows the opposite conditions.
Read More: Best Forex Indicators in 2026
Final Thoughts about VWAP Indicator
The VWAP Indicator combines price and volume to provide a reference for the average price traded during a session. It can help traders identify intraday trends, dynamic support and resistance, pullback opportunities, and potential breakout setups.
Source: Investopedia









