
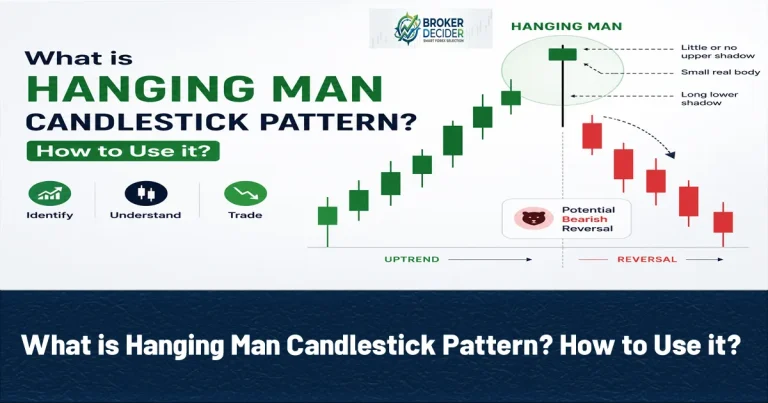
The Hanging Man Candlestick Pattern is a bearish reversal pattern. It may appear near the end of an uptrend. Hanging Man warns traders that selling pressure has entered the market and that the existing bullish momentum may be weakening. The Hanging Man of course is not a standalone sell signal. Its reliability improves when it appears at a resistance level and is followed by bearish confirmation.
The Shape of Hanging Man Candlestick Pattern
The Hanging Man Candlestick Pattern is a single candle formation that has a small real body near the top of the trading range, a long lower shadow, and little or no upper shadow. The lower shadow is at least twice the size of the real body. The pattern normally forms after an uptrend. During the candle’s formation, sellers manage to push the price significantly lower, creating the long lower wick. Buyers then recover much of that decline before the candle closes. This shows that sellers have become active, even though buyers were still able to recover the price by the close.
Read More: What is Shooting Star Candlestick Pattern? How to Use it?
Identifying a Hanging Man Pattern
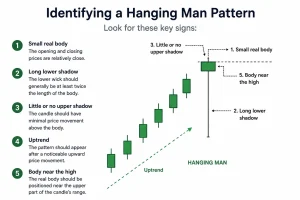
For identifying a Hanging Man Pattern, look for these signs:
- Small real body: The opening and closing prices are relatively close.
- Long lower shadow: The lower wick should generally be at least twice the length of the body.
- Little or no upper shadow: The candle should have minimal price movement above the body.
- Uptrend: The pattern should appear after a noticeable upward price movement.
- Body near the high: The real body should be positioned near the upper part of the candle’s range.
The Hanging Man Candlestick Pattern Signals
Lets tell you about the Hanging Man Candlestick Pattern Signals with an example. Imagine that a market is moving higher and buyers appear to be in control. During one trading period, sellers suddenly push the price substantially lower. Buyers eventually recover most of the decline, leaving a small body near the top of the candle. Although buyers managed to recover the price, the long lower shadow reveals that selling pressure was strong enough to drive the market significantly lower during the session. When this happens after an extended uptrend, traders may interpret it as an early sign that bullish momentum is losing strength. However, the market can still continue higher, which is why confirmation is essential.
Hanging Man and Hammer Candlestick difference
Hanging Man and Hammer Candlestick have some similarities but their interpretation is different. Look at the table below:
| Main Features | Hanging Man Candlestick | Hammer Candlestick |
| Lower shadow | Long | Long |
| Real body | Small | Small |
| Bullish reversal | Little or none | Little or none |
| Potential signal | Bearish reversal | Bullish reversal |
| Market context | Uptrend | Downtrend |
Read More: What is Doji Candle? How to Use it?
How to Trade With The Hanging Man Candlestick?
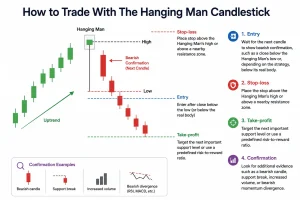
For trading with The Hanging Man Candlestick, you as a trader can use these details:
- Entry: Wait for the next candle to show bearish confirmation, such as a close below the Hanging Man’s low or, depending on the strategy, below its real body.
- Stop-loss: Place the stop above the Hanging Man’s high or above a nearby resistance zone.
- Take-profit: Target the next important support level or use a predefined risk-to-reward ratio.
- Confirmation: Look for additional evidence such as a bearish candle, support break, increased volume, or bearish momentum divergence.
Best Conditions for The Hanging Man Candlestick trading
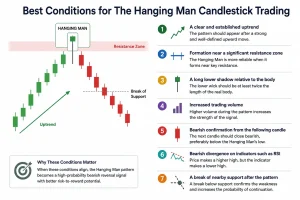
If you want to use The Hanging Man Candlestick as a signal producer, you’d better to enter the market just after you see these conditions:
- A clear and established uptrend
- Formation near a significant resistance zone
- A long lower shadow relative to the body
- Increased trading volume
- Bearish confirmation from the following candle
- Bearish divergence on indicators such as RSI
- A break of nearby support after the pattern
Read More: What is Engulfing Pattern? How to Use it?
Conclusion about Hanging Man Candlestick Pattern
The Hanging Man Candlestick Pattern is a useful price action formation for identifying potential weakness near the top of an uptrend. Its small body and long lower shadow reveal that sellers were able to create significant downward pressure during the session.
Visit Broker Decider Reddit page for more information.
Source: Investopedia









