
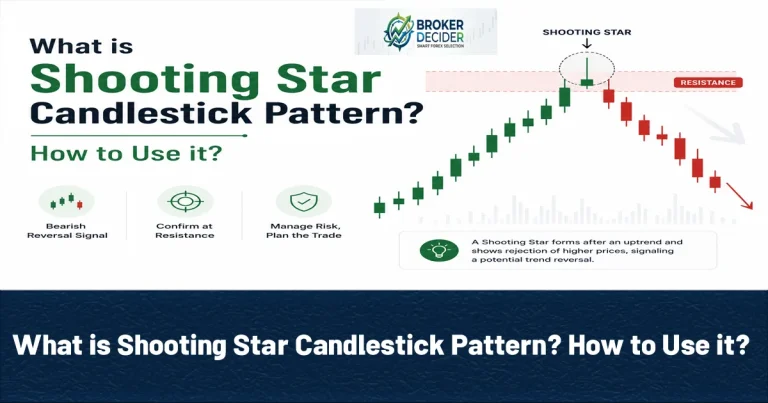
The Shooting Star Candlestick Pattern is a bearish reversal candlestick that shows a potential change from an uptrend to a downtrend. The Shooting Star is most useful when it appears after a strong price increase and near an important resistance level.
What is Shooting Star Candlestick Pattern?
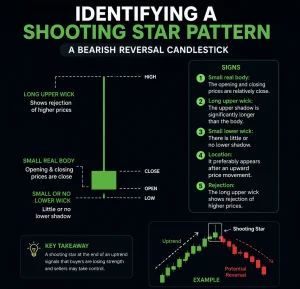
The existence of Shooting Star Candlestick Pattern shows that buyers pushed the price significantly higher during the trading session, but sellers eventually took control and forced the price back toward the opening level. The pattern has a small real body near the lower part of the candle and a long upper shadow. Ideally, the upper wick should be at least twice the size of the real body, while the lower shadow should be very small or absent. The pattern becomes more meaningful when it forms after an established uptrend because its structure indicates that higher prices were rejected.
Read More: What is Hammer Candlestick Pattern? How to Use it?
Identifying a Shooting Star Pattern
For Identifying a Shooting Star Pattern, follow these Signs:
- Small real body: The opening and closing prices are relatively close.
- Long upper wick: The upper shadow is significantly longer than the body.
- Small lower wick: There is little or no lower shadow.
- Location: It preferably appears after an upward price movement.
- Rejection: The long upper wick shows rejection of higher prices.
What Does a Shooting Star Tell us?
The psychology behind the Shooting Star Candlestick Pattern is more important than its appearance alone. At the beginning of the session, buyers are in control and push the price higher. During the session, however, sellers enter the market and reverse much of that upward movement. Price eventually closes near the lower portion of the candle. This creates a visible rejection of higher prices. When the pattern develops after a prolonged rally, it can suggest that bullish momentum is weakening and that sellers may be preparing to take control. Nevertheless, a Shooting Star does not guarantee a reversal. Price can continue higher if buyers regain control in the following sessions.
Shooting Star and Inverted Hammer
The Shooting Star and Inverted Hammer look mostly identical but there are also differences. Shooting Star Typical Location is After an uptrend but Inverted Hammer Typical Location is After a downtrend. Also, Shooting Star Potential Meaning is a Bearish reversal but Inverted Hammer Potential Meaning is a bullish reversal. Therefore, traders should never identify either pattern based only on its shape. Market context is essential.
Read More: What is Doji Candle? How to Use it?
Trading with Shooting Star Candlestick Pattern
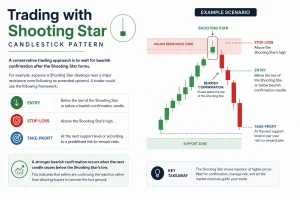
A conservative trading approach is to wait for bearish confirmation after the Shooting Star forms. For example, suppose a Shooting Star develops near a major resistance zone following an extended uptrend. A trader could use the following framework:
- Entry: Below the low of the Shooting Star or below a bearish confirmation candle
- Stop-loss: Above the Shooting Star’s high
- Take-profit: At the next support level or according to a predefined risk-to-reward ratio
A stronger bearish confirmation occurs when the next candle closes below the Shooting Star’s low. This indicates that sellers are continuing the rejection rather than allowing buyers to recover the lost ground.
Support and Resistance in Shooting Star
One of the best ways to improve the reliability of the Shooting Star Candlestick Pattern is to combine it with support and resistance. A Shooting Star forming directly below a significant resistance level can be more relevant than one appearing in the middle of a trend. The resistance zone provides a logical explanation for why buyers failed to maintain higher prices. Traders can also combine the pattern with previous swing highs, trendlines, supply zones, or other technical analysis tools.
Read More: What is Engulfing Pattern? How to Use it?
Shooting Star and Indicators
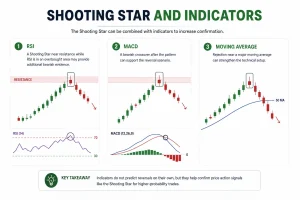
The Shooting Star can be combined with indicators to increase confirmation. For example:
- RSI: A Shooting Star near resistance while RSI is in an overbought area may provide additional bearish evidence.
- MACD: A bearish crossover after the pattern can support the reversal scenario.
- Moving Average: Rejection near a major moving average can strengthen the technical setup.
Conclusion about Shooting Star Candlestick Pattern
The Shooting Star Candlestick Pattern is a bearish reversal formation characterized by a small body, a long upper wick, and little or no lower shadow. It is most significant after an uptrend and near resistance. For better trading decisions, wait for confirmation, identify the broader market structure, use logical stop-loss and take-profit levels, and combine the pattern with other forms of technical analysis.
Source: Investopedia









