
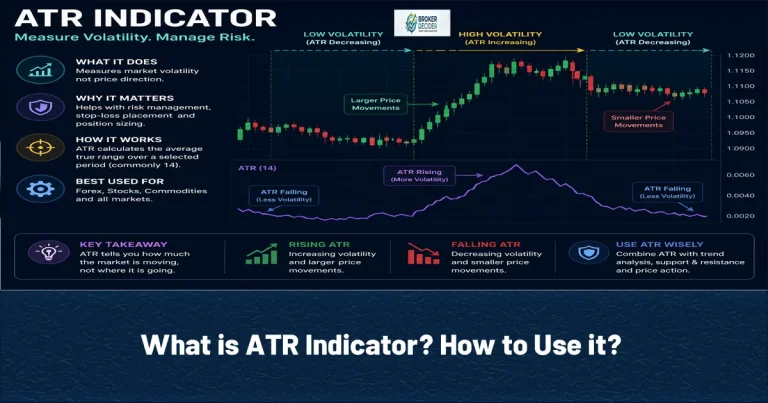
The ATR Indicator (Average True Range) measures market volatility. Unlike indicators like RSI or MACD, ATR doesn’t determine whether the market is bullish or bearish. It measures how much price is moving over a selected period. This makes the ATR Indicator good for risk management, stop-loss placement, position sizing, and evaluating market conditions.
The ATR Indicator
The average range of price movement can be measured by The ATR Indicator. It can also accounting for gaps between the previous closing price and the current period’s high or low. Look at the simple interpretation of The ATR Indicator:
- ATR is Rising: volatility is Increasing
- ATR is Falling: volatility is Decreasing
- ATR is High: Larger price movements is coming (opposite of bullish movement)
- ATR is Low: Smaller price movements is coming (opposite of bearish movement)
True Range in ATR
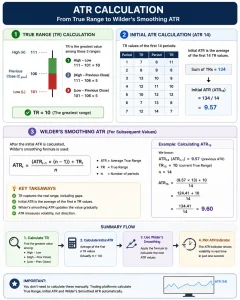
True Range accounts for the current candle’s range as well as potential gaps from the previous close. For each period, True Range is the largest of these three values:
- Current High minus Current Low
- Current High minus Previous Close
- Current Low minus Previous Close
Imagine that Current High is 106, Current Low is 99 and Previous Close is 96. So, the ranges are:
- 106 – 99 = 7
- 106 – 96 = 10
- 99 – 96 = 3
So the correct range is 10. The previous closing price is included because it allows True Range to capture gaps and larger effective price movements.
Read More: What is VWAP Indicator? How to Use it?
ATR Calculation
After we calculate the True Range, we can determine ATR. The only thing that is needed is selecting the period. In ATR Calculation, traders usually use 14 periods that is called ATR 14.
The formula for Initial ATR Calculation is:
Initial ATR = The value of the ATR of each period / Number of period
For subsequent values, the traditional Wilder ATR uses a smoothing method to incorporate the newest True Range while retaining information from previous periods. After the initial ATR is calculated, the standard Wilder’s smoothing method is commonly used. The formula of it is:
ATRt = (ATRt -1 * (n-1)) + TRt / N
- ATR = Average True Range
- TR = True Range
- n = Number of periods
Example of True Range, Initial ATR and Wilder’s smoothing ATR
Imagine that the information of a candle is like this:
- High: 111
- Low: 101
- Previous Close: 106
According to this Formula:
- Current High minus Current Low
- Current High minus Previous Close
- Current Low minus Previous Close
We have this 3 ranges:
111-101= 10
111-106= 5
101-106= 5
Between These ranges, 10 is the top. So:
TR = 10
After measuring TR, Now its time to measure Initial ATR. Imagine that we have 14 periods and 14 candles. The TR of these 14 candles are:
- candle 1: 7
- candle 2: 8
- candle 3: 13
- candle 4: 12
- candle 5: 10
- candle 6: 7
- candle 7: 12
- candle 8: 11
- candle 9: 8
- candle 10: 9
- candle 11: 10
- candle 12: 12
- candle 13: 8
- candle 14: 7
For measuring Initial ATR, First we have to sum up the TR and the divide it to the 14 that is the number of TRs. So:
7+8+13+12+10+7+12+11+8+9+10+12+8+7= 134
134/14=9.57
Finally, Its time to measure Wilder’s smoothing ATR. The formula of it is:
ATRt = (ATRt -1 * (n-1)) + TRt / N
We now that ATR14 (ATRt -1) = 9.57 that is the Previous. So ATR15 can be measure like this:
ATRt = 9.57 * 13+10 / 14
ATRt = 9.60
You don’t need to be worry about the calculation process of True Range, Initial ATR and Wilder’s smoothing ATR. ATR Indicator can measure all of them in just one second.
Read More: EMA vs SMA (What’s The difference?)
ATR 14 Meaning
ATR 14 means that the indicator uses 14 periods as its standard calculation period. Traders can change this setting depending on their strategy and timeframe. ATR 7 is Faster and more sensitive, ATR 10 is More responsive, ATR 14 is Common standard setting, ATR 21 is Smoother and ATR 28 is Less sensitive to short-term changes.
Reading ATR Indicator
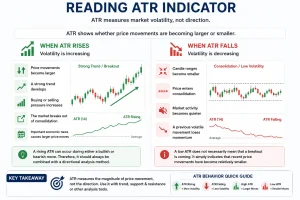
The ATR Indicator becomes more useful when traders understand how changes in its value reflect changes in market volatility. ATR does not identify whether buyers or sellers will win; instead, it shows whether price movements are becoming larger or smaller.
- When ATR rises, it generally indicates that market volatility is increasing. This can happen when Price movements become larger, A strong trend develops, Buying or selling pressure increases, The market breaks out of consolidation or Important economic news causes larger price movements. A rising ATR can occur during either a bullish or bearish move. Therefore, it should always be combined with a directional analysis method.
- When ATR falls, it generally indicates that market volatility is decreasing. This may occur when Candle ranges become smaller, Price enters consolidation, Market activity becomes quieter or A previous volatile movement loses momentum. A low ATR does not necessarily mean that a breakout is coming. It simply indicates that recent price movements have become relatively smaller.
Trending Markets and ATR
During a strong trend, ATR can increase as the size of price movements grows. Imagine that EUR/USD breaks above a major resistance level and begins forming higher highs and higher lows. If ATR rises at the same time, it indicates that the magnitude of price movement is increasing. However, ATR does not confirm that the trend is bullish. A trader can combine Market Structure, Price Action and ATR. Market structure provides directional information, while ATR provides information about volatility. The same principle applies to bearish trends.
Read More: What is Bollinger Bands Indicator? How to Use it?
Ranging Markets and ATR
ATR can also help traders identify periods of relatively low volatility. For example, imagine price repeatedly moves between support and resistance while candle ranges become progressively smaller. If ATR also declines, the market may be entering a quieter consolidation phase. This information can be useful when monitoring a potential breakout. However, low ATR does not guarantee a breakout. Markets can remain in low-volatility conditions for an extended period.
Economic News and ATR
Major economic events can produce sudden changes in market volatility. Examples include Interest rate decisions, Inflation reports, Employment data, Central bank announcements and Major economic statements. When these events cause unusually large price movements, ATR may begin rising. This can alert traders that normal market conditions have changed and that previously used stop-loss distances or position sizes may no longer be appropriate.
ATR for Stop-Loss
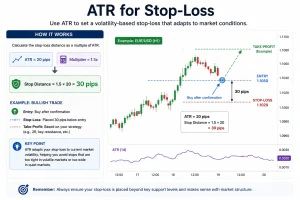
One common approach is to calculate the stop-loss distance as a multiple of ATR. For example, if ATR = 20 pips and the trader chooses a multiplier of 1.5:
Stop Distance = 1.5 × 20 = 30 pips
A bullish trade could therefore have its stop-loss approximately 30 pips below the entry, provided that this location also makes sense based on market structure.
ATR for Position Sizing
One of the most useful applications of ATR is adjusting position size according to volatility. Suppose a trader has a $10,000 account and decides to risk 1% per trade. Maximum risk:
$10,000 × 1% = $100
If the ATR-based analysis results in a 40-pip stop-loss, the trader can calculate a position size that limits the potential loss to approximately $100. If volatility increases and the required stop becomes 60 pips, the position size should generally be reduced if the trader wants to maintain the same $100 maximum risk.
Read More: Best Forex Indicators in 2026
ATR for Take-Profit Targets
ATR can also provide a reference for potential price targets. For example, if ATR is 25 pips, a trader might use a multiple such as:
2 × ATR = 50 pips
As one possible volatility-based reference. However, take-profit levels should not be determined by ATR alone.
Final Thoughts about ATR Indicator
The ATR Indicator is a practical tool for understanding market volatility and adapting risk management to changing conditions. Its most important applications include Measuring volatility, Adjusting stop-loss distances, Calculating position size, Evaluating potential price targets and Identifying changes in market activity.
Source: Investopedia









