
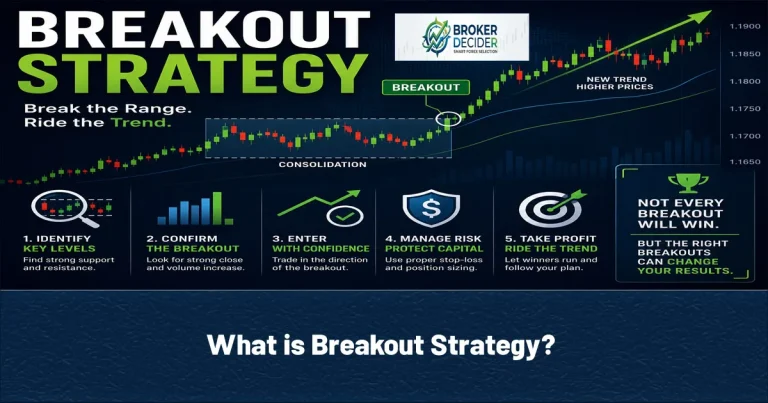
In breakout strategy, trader enters the market when price moves decisively beyond a key support or resistance level, on the idea that a new trend is starting. Instead of trading inside a range, breakout traders wait for price to escape consolidation with real momentum and liquidity behind it. A strong strategy isn’t just watching price cross a line; it weighs volume, structure, volatility, the higher-timeframe trend, and nearby levels before deciding whether a move is genuine or about to snap back.
What is Breakout Strategy Exactly?
Markets spend most of their time consolidating before making a real directional move. A breakout is what happens when that balance breaks — one side takes control and pushes price past a level that had been holding. If enough participation follows through, that push turns into a sustained trend. The goal isn’t predicting a turning point the way a reversal strategy does — it’s entering early enough to catch a new trend once the market has already shown its hand, while managing the real risk that the move fails.
Why Breakout Strategy is important?
Markets alternate between consolidation and trend, and a large share of the strongest moves start right after consolidation ends. EUR/USD trading between 1.1600 support and 1.1650 resistance for three sessions, then breaking above 1.1650 on stronger-than-expected Eurozone data and rallying another 95 pips over the next two sessions, is the pattern breakout traders are built around.
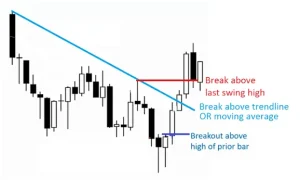
4 Types of Breakout
Breakout has different types that are:
- Resistance breakout: Gold testing $3,420 multiple times before buyers push it to $3,438 signals buying pressure overwhelming sellers.
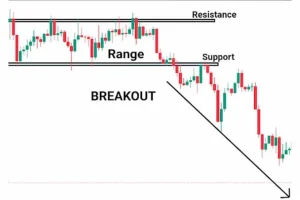
- Support breakout: USD/JPY holding above 147.50 for days, then dropping through it on weak data and falling another 120 pips.
- Range breakout: NASDAQ 100 trading between 23,150 and 23,480 for a week, then closing above 23,480 on rising buying activity.
- Chart pattern breakouts: price escapes consolidation and potentially accelerates.
The Reason of Breakout Happening
Breakouts don’t happen randomly. Liquidity, order flow, and new information drive them. The Reason of Breakout Happening are:
- Central bank announcements,
- Inflation
- Jobs data
- Geopolitical surprises
- Institutional flow
- Sudden sentiment shifts
- An unexpected Fed rate cut
False and real Breakouts
A false breakout happens when price pokes past a key level and snaps right back into the range — common because large players often hunt liquidity around obvious levels before making their real move. EUR/USD repeatedly failing at 1.1250, briefly touching 1.1258 during London, then falling back to close at 1.1235 within the hour is a classic false breakout. Patience beats speed here more often than not.
An Example of Breakout Strategy
EUR/USD is bullish on the weekly and daily, consolidating on the 4H between 1.1735 support and 1.1780 resistance for four days. During London, a strong bullish candle closes at 1.1794 — a genuine close beyond resistance, not just a touch.
Entry 1.1795, stop 1.1768 (27 pips risk), target 1.1850 (55 pips reward) — roughly 1:2. The trade isn’t built on the breakout alone; it stacks the higher-timeframe trend, a confirmed close, an active session, and a favorable reward-to-risk ratio, which is exactly the layering that filters out low-quality setups.
Immediate entry and Retest Entry in breakout
- Immediate entry: Acts as soon as the breakout confirms. Earlier, more room for reward, but more exposure to a false breakout with a less precise stop.
- Retest Entry: Waits for price to return to the broken level. EUR/USD breaks resistance at 1.1180, pushes to 1.1205, then pulls back to 1.1182. If buyers defend that former resistance as new support, that’s the entry. Better risk-to-reward, at the cost of missing breakouts that never retest. Most experienced traders lean toward the retest when they can get it.
Indicators for Breakout Strategy
ATR measures volatility expansion — rising ATR after a long contraction adds weight to a breakout thesis. Volume matters more in stocks and futures than Forex, where only tick volume exists. Moving averages (the 200-day especially) show which direction the broader trend favors. RSI adds momentum context but was never designed to trigger an entry alone.
Best Timeframes for Breakout Strategy
| Trading Styles | Entry Timeframe | Higher-Timeframe Context |
| Scalping | 1M–5M | 15M |
| Day Trading | 5M–15M | 1H–4H |
| Swing Trading | 1H–4H | Daily |
| Position Trading | Daily | Weekly |
Example for trading with Breakout Strategy with suitable Timeframes
Gold trades between $3,430 support and $3,480 resistance for eight sessions. U.S. inflation comes in below expectations, and gold closes above resistance at $3,492. Rather than buying immediately, the trader waits for a retracement back to $3,482, where buyers defend the old resistance.
Entry $3,485, stop $3,460 ($25 risk), target $3,540 ($55 reward) — roughly 1:2.2. Higher-timeframe trend, confirmed breakout, successful retest, a genuine fundamental catalyst, and defined risk before entry — that combination beats buying every level break on sight.
Risk Management in Breakout Strategy
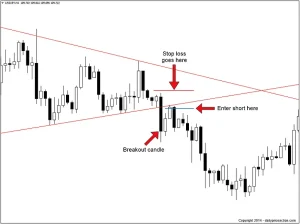
Most experienced traders risk 0.5–2% of account equity per trade. A $10,000 account at 1% caps risk at $100 regardless of how good a GBP/USD setup with a 40-pip stop looks — the position gets sized to fit that ceiling, not the other way around.
- Stop placement matters more than people think.
- Set the target before entering,
Final Thoughts about Breakout Strategy
A breakout strategy is popular because it aims to catch trends early — but doing that consistently takes more than spotting a line on a chart. It takes market context, real confirmation, disciplined risk management, and the patience to skip setups that don’t meet the bar. Selective entries beat trading every apparent breakout, and no method guarantees a result. What compounds over time is following a defined plan and sizing risk properly on every setup, not just the ones that felt obvious in hindsight.
Source: Investopedia









