
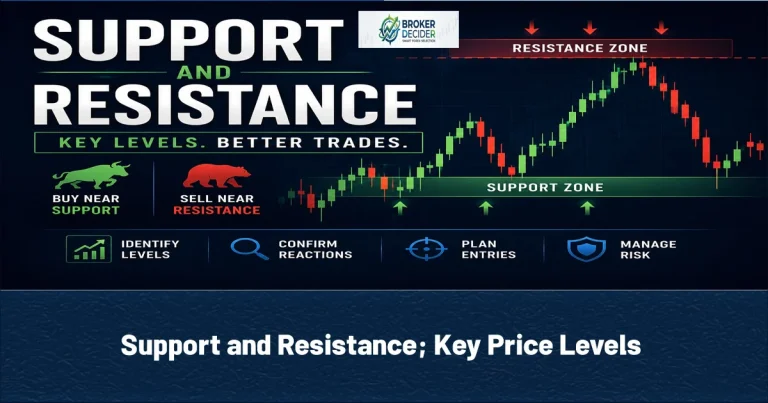
Support and Resistance are among the fundamental concepts in technical analysis. A Support level is an area where demand has previously been strong enough to slow or stop a decline, while a Resistance level is an area where selling pressure has historically capped further price gains. This article covers what Support and Resistance really mean and how the concept fits into a broader Smart Money Concepts framework.
Support and Resistance
Neither level guarantees a turning point, but both help traders flag areas where price is more likely to react. That’s precisely why Support and Resistance remain so widely used across Forex, stocks, commodities, indices, and cryptocurrencies alike.
Why Support and Resistance are important?
Financial markets rarely move in a straight line. Instead, price tends to pause, reverse, or consolidate around key levels where buyers and sellers actively interact. Understanding Support and Resistance helps traders identify potential entry and exit zones, improve risk management, recognize possible reversals, confirm breakout opportunities, read market psychology, and build more structured trading plans. Rather than predicting the future outright, these levels simply provide useful context for interpreting price action.
The concept of Support
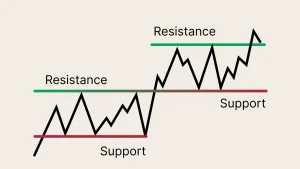
A Support level is a price area where buying interest has previously overcome selling pressure. As price approaches support, buyers often become more active, which can cause a decline to slow or reverse. Support shouldn’t be treated as one exact price. Strong support areas tend to develop only after price has reacted there repeatedly.
The concept of Resistance
A Resistance level is a price area where selling pressure has historically outweighed buying pressure. As price approaches resistance, sellers often step in, which tends to slow upward momentum. Just like support, resistance is typically better understood as a zone rather than a precise number.
The formation of Support and Resistance
Support and Resistance develop largely because traders remember important price levels. If the market has previously reversed from a particular area, plenty of participants pay close attention whenever price returns there. Institutional traders, retail traders, and algorithmic systems can all react around similar zones, which drives an increase in buying or selling activity right at that level.
Support and Resistance Types
Support and Resistance can show up in a few different forms that are:
Horizontal S&R
These are the most common type. Price repeatedly reacts at roughly the same area without any meaningful slope, which makes horizontal levels easy to spot and among the most widely used tools in technical analysis.
Dynamic S&R
Dynamic levels shift over time rather than sitting still. Moving averages, trend lines, and regression channels are all common examples. Unlike horizontal levels, dynamic support and resistance evolve as price itself evolves.
Psychological Levels
Round numbers tend to attract a noticeable jump in trading activity. These psychological levels often shape trader behavior even when there’s no clear technical reason behind them.
Identifying Support and Resistance
For Identifying Support and Resistance, follow these steps:
| Step 1 | Use a Higher Timeframe | Daily and four-hour charts tend to reveal stronger, more meaningful levels than lower timeframes do, since higher-timeframe zones generally carry more weight. |
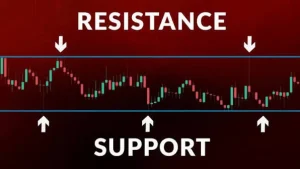
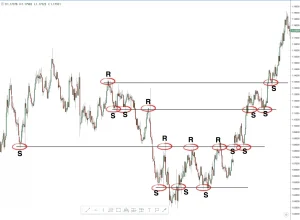
| Step 2 | Find Repeated Reactions | Look for areas where price has reversed more than once. The more times a level has produced a reaction, the more confidence traders can place in it being genuinely meaningful. |
| Step 3 | Focus on Zones | Avoid treating Support and Resistance as exact prices. Instead, mark out the broader area where buying or selling activity has consistently shown up. |
| Step 4 | Wait for Price Confirmation | Simply reaching a support or resistance level doesn’t automatically create a trading opportunity. Many traders wait for confirmation through candlestick patterns, market structure, or volume before actually entering a position. |
Smart Money Concepts and Support & Resistance
Traditional technical analysis often treats these levels as standalone trading signals on their own. Within Smart Money Concepts (SMC), though, Support and Resistance are viewed a little differently as areas where liquidity is likely to accumulate. Institutional traders may use these zones to access that liquidity before driving price in a new direction entirely.
As a result, many SMC traders combine Support and Resistance with Market Structure, Liquidity, Liquidity Sweeps, Order Blocks, Fair Value Gaps (FVG), Break of Structure (BOS), and Change of Character (CHOCH). This broader context helps separate genuinely high-quality setups from ordinary, everyday price reactions.
Support and Resistance Comparison
| Support | Resistance |
| Forms below current price | Forms above current price |
| Represents stronger demand | Represents stronger supply |
| Acts as a potential buying zone | Acts as a potential selling zone |
| May slow or stop declines | May slow or stop advances |
Common Mistakes in Using Support and Resistance
Common Mistakes in Using Support and Resistance are:
- Ignoring the trend
- Treating levels as exact prices
- Ignoring higher timeframes
- Trading every breakout
Advantages and Disadvantages of Using Support and Resistance
| Advantages of Using S&R | Disadvantages of Using S&R |
| Works across multiple financial markets | Don’t guarantee reversals |
| Improves risk management | False breakouts happen regularly |
| Helps identify potential reversal zones | Confirmation is necessary before acting |
| Easy to understand | News events can invalidate technical levels |
| Combines well with Smart Money Concepts | *** |
| Complements broader price action analysis | *** |
Final Word about S&R
Support and Resistance help traders identify where buying and selling pressure is likely to influence future price movement. While these levels are far from perfect predictors, they provide genuinely valuable context for understanding market behavior and planning trades around it.
Source: CoinMarketCap









