

The New York Kill Zone is the short, high-liquidity window right after the New York Forex session opens. ICT and Smart Money Concepts traders watch it closely because fresh institutional order flow, the London–New York overlap, and U.S. macro data all tend to collide here at once.
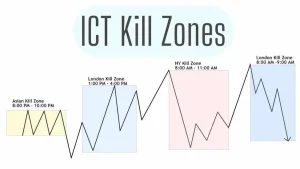
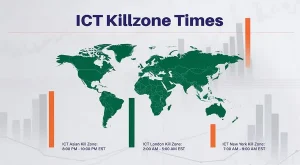
It’s a narrower slice than the full New York session. The Kill Zone is just the opening stretch, generally accepted as 12:00–15:00 GMT (roughly 07:00–10:00 AM Eastern), though the exact boundary drifts by an hour whenever the U.S. and Europe switch clocks on different calendar dates. Like the London Kill Zone, it’s not an officially recognized session. It’s a concept from ICT teaching, adopted widely across Smart Money Concepts to describe when U.S. institutional participation peaks.
New York Session and New York Kill Zone
New York Session and New York Kill Zone get confused constantly, and the mix-up causes real problems. Traders staring at 6 p.m. London-time charts expecting Kill Zone volatility that left hours earlier. Look at the table below:
| Features | New York Session | New York Kill Zone |
| Hours | 13:00–22:00 GMT | 12:00–15:00 GMT |
| Duration | ~9 hours | ~2–3 hours |
| Status | Official Forex session | ICT session |
| Scope | All U.S. trading activity | The highest-liquidity opening stretch |
The Importance of the New York Kill Zone
This isn’t just “another market opening.” Three separate forces line up here:
- London is still fully open.
- US. banks and institutional desks start executing.
- Major American economic data drops, often within the first hour.
That combination is what drives the liquidity spike. Per the 2025 BIS Triennial Central Bank Survey, published in September 2025, U.S. daily forex turnover reached $2.33 trillion in April 2025, up 20.35% from 2022. That keeps the United States the second-largest FX center globally, behind the UK, whose desks still handle roughly double New York’s volume.
U.S. Economic News and the New York Kill Zone
The timing isn’t an accident — many of the market’s most influential releases are scheduled right after the New York open, including Non-Farm Payrolls, CPI, PPI, Retail Sales, GDP, and Federal Reserve rate decisions. These can move price sharply within minutes. But faster movement isn’t automatically a better opportunity — it also widens spreads, increases slippage, and can trigger stops before any real direction has formed.
The Core ICT Concepts of the New York Kill Zone
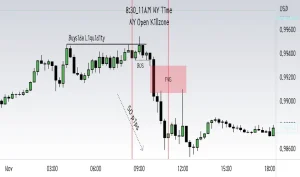
- Liquidity Sweep: Price briefly pushes past a well-known high or low clearing stop and pending orders before the real move develops. It’s context, not a signal on its own.
- Power of Three: Accumulation, Manipulation, Distribution — price consolidates, fakes a move to grab liquidity, then reverses into its real trend. A useful lens, not a guaranteed daily script.
- Silver Bullet Strategy: Waits for a liquidity sweep, a Market Structure Shift, and a Fair Value Gap, then enters on a retrace into that gap — prioritizing trade location over chasing the breakout candle.
- MSS and BOS: After liquidity is taken, traders watch for the first break of a recent swing point as evidence short-term control has changed hands. BOS usually confirms a trend continuing; MSS flags the earliest sign it might be turning.
- CHOCH: A step further than MSS — the first break of a pattern that’s held for a while, suggesting the prevailing side may be losing control. Needs the higher timeframe for context.
- Order Blocks and FVGs: An Order Block is the last opposing candle before a strong impulsive move — watched for support or resistance on a return visit. A Fair Value Gap is the imbalance left when price moves too fast for both sides to trade evenly; sometimes revisited, sometimes not.
Which Markets Move Most?
| Markets | Activity |
| XAU/USD, NASDAQ 100, S&P 500 | Very high |
| EUR/USD, GBP/USD | Very high |
| USD/JPY, USD/CAD, US30 | High |
Spreads and Slippage in the New York Kill Zone
| Markets | Usual Spreads | New York Kill Zone Spread |
| GBP/USD | 1.5–2.5 pips | 0.3–0.8 pips |
| USD/CAD | 1.5–2.5 pips | 0.4–0.9 pips |
| EUR/USD | 1.2–2.0 pips | 0.1–0.5 pips |
| USD/JPY | 1.0–1.8 pips | 0.2–0.6 pips |
New York Kill Zone vs. London Kill Zone
| Features | London Kill Zone | New York Kill Zone |
| Driven by | European market open | U.S. open + London overlap |
| Institutional flow | Primarily European | European and North American |
| Best suited for | EUR, GBP pairs | USD pairs, Gold, U.S. indices |
| Reacts to | Asian session range | London session range |
Final Thoughts about New York Kill Zone
The New York Kill Zone earns its reputation from three forces stacking together: a $2.33 trillion-a-day market waking up, the overlap with London’s still-active desks, and the timing of the week’s most influential U.S. data. That combination produces the liquidity and volatility this window is known for.
Source: Investopedia









