
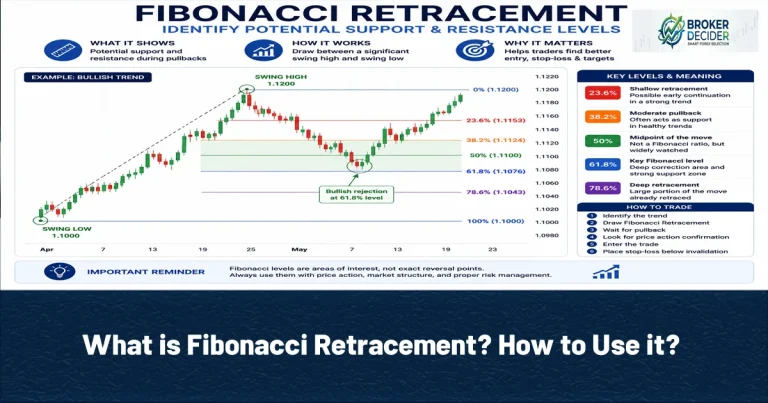
Fibonacci Retracement is an indicator that used in technical analyses to find possible support and resistance areas during a price correction. Fibonacci Retracement can be used in different markets such as Forex, stocks, commodities, and cryptocurrency.
Fibonacci Retracement
Fibonacci Retracement has different percentage levels that are used for measuring how far a market may retrace after a previous price movement. Fibonacci famous percentage levels are:
- 23.6%
- 38.2%
- 50%
- 61.8%
- 78.6%
For instance, imagine USD/JPY moves from 1.1000 to 1.1150 during an uptrend. After reaching 1.1150, the price begins to decline. A trader can use Fibonacci Retracement to identify potential areas where the correction might slow down or find support. The important idea is that Fibonacci levels do not predict exactly where the market will reverse. Instead, they provide reference levels for analyzing potential pullbacks.
Sequence and the Golden Ratio of Fibonacci
Fibonacci Retracement is based on relationships derived from the Fibonacci sequence, where each number is the sum of the two preceding numbers: 0, 1, 1, 2, 3, 5, 8, 13, 21, 34, 55…
Ratios between numbers in the sequence produce several percentages used in technical analysis. The 61.8% level is particularly important because it is closely associated with the mathematical golden ratio, approximately 0.618. The 38.2% level is also derived from Fibonacci relationships, while 23.6% represents another commonly observed ratio. The 50% level is not technically a Fibonacci ratio, but traders commonly include it in Fibonacci Retracement tools because markets frequently react around the halfway point of a previous move.
Read More: What is ATR Indicator? How to Use it?
Fibonacci Functions
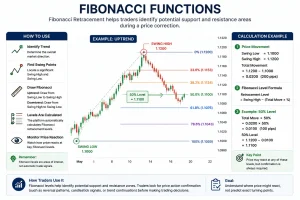
To use Fibonacci Retracement, traders first need to identify a significant Swing High and Swing Low. In an uptrend, the tool is generally drawn from the Swing Low to the Swing High. In a downtrend, it is generally drawn from the Swing High to the Swing Low. The software then automatically calculates the selected retracement levels between these two price points.
For example, suppose a currency pair moves from: Swing Low = 1.1000 to: Swing High = 1.1200. The total movement is: 1.1200 − 1.1000 = 0.0200. The Fibonacci levels are then positioned at different percentages of this movement. For instance, a 50% retracement would represent approximately half of the previous move: 0.0200 × 50% = 0.0100. Therefore, the 50% retracement area would be around 1.1100. A trader can then monitor how price behaves around the calculated levels rather than automatically entering a trade simply because price reaches one of them.
The Important Fibonacci Retracement percentage Levels
Each level of Fibonacci Retracement can provide different information about the market. look at the table below:
| Fibonacci Retracement percentage Levels | Interpretation |
| 78.6 percentage | Deep retracement |
| 61.8 percentage | Important potential retracement area |
| 50 percentage | Midpoint of the previous move |
| 38.2 percentage | Moderate pullback |
| 23.6 percentage | Very shallow retracement |
A shallow retracement, such as 23.6%, can occur when the underlying trend remains relatively strong. A deeper retracement toward 61.8% or 78.6% may indicate a stronger correction, although it does not automatically mean that the original trend has ended.
Read More: What is VWAP Indicator? How to Use it?
Drawing Fibonacci Retracement
For drawing Fibonacci Retracement, follow these steps:
- Identify the dominant market trend
- Find a significant Swing High and Swing Low
- Select the Fibonacci Retracement tool on the trading platform
- Draw the tool between the relevant swing points
- Monitor the major Fibonacci levels
- Wait for price action or another form of confirmation
The accuracy of the analysis depends heavily on selecting meaningful swing points. Drawing Fibonacci between random highs and lows can produce levels that have little practical value.
Read More: EMA vs SMA (What’s The difference?)
Reading Fibonacci Retracement Levels
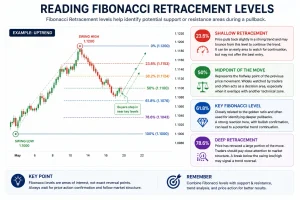
Understanding how price behaves around each Fibonacci Retracement level is more important than simply knowing the percentages. Traders generally use these levels as potential areas of support or resistance and then wait for additional confirmation before entering a position.
- 23.6%: The 23.6% level represents a shallow retracement. When a market is moving strongly in one direction, price may only pull back slightly before continuing the existing trend. In such conditions, the 23.6% level can become an area where traders watch for a potential continuation. However, a shallow retracement can also mean that price has not corrected enough to provide a favorable entry.
- 50%: The 50% level represents the halfway point of the previous price movement. Although 50% is not technically a Fibonacci ratio, it is widely included in Fibonacci Retracement tools because traders often pay attention to the midpoint of a major move. A price reaction around 50% can therefore provide useful market context, particularly when the level overlaps with another technical area.
- 61.8%: The 61.8% level is one of the most closely watched Fibonacci levels. It is associated with the mathematical golden ratio and is frequently monitored for potential pullbacks. For example, in an established uptrend, a retracement toward 61.8% may represent a deeper correction. If buyers step in around this area and price forms a bullish confirmation pattern, the level may become part of a potential continuation setup. However, a reaction at 61.8% should not automatically be interpreted as a guaranteed reversal.
- 78.6%: The 78.6% level represents a deep retracement. When price reaches this area, a large portion of the previous movement has already been retraced. Traders may therefore pay closer attention to market structure to determine whether the original trend is still valid. A strong break beyond the relevant swing point can provide evidence that the previous trend may no longer be intact.
Bullish Trends and Fibonacci Retracement
During an uptrend, traders typically draw Fibonacci Retracement from the Swing Low to the Swing High. After the upward movement, price may begin a correction. Traders can then monitor levels such as 38.2%, 50%, and 61.8% for potential support. A simplified bullish setup can look like this:
Swing Low → Strong Upward Move → Pullback → Fibonacci Level → Bullish Confirmation → Potential Continuation
For example, if price reaches the 61.8% level and simultaneously forms a bullish rejection candle near a previous support zone, the combination may provide stronger evidence than the Fibonacci level alone.
Read More: What is Bollinger Bands Indicator? How to Use it?
Bearish Trends and Fibonacci Retracement
The same concept can be applied to a downtrend. In a bearish market, traders generally draw Fibonacci Retracement from the Swing High to the Swing Low. If price then moves upward temporarily, the retracement levels can be used as potential resistance areas. A simplified bearish setup is:
Swing High → Strong Downward Move → Pullback → Fibonacci Level → Bearish Confirmation → Potential Continuation
For example, price may retrace toward the 50% or 61.8% level and then show bearish rejection near an established resistance zone.
Fibonacci Retracement as Support and Resistance
One of the most common applications of Fibonacci Retracement is identifying potential support and resistance. However, Fibonacci levels become more meaningful when they overlap with other technical factors. For example:
Fibonacci 61.8% + Previous Support + Bullish Price Action
may provide a stronger area of interest than a 61.8% level appearing by itself. This concept is often called confluence. Useful forms of confluence can include:
- Previous support or resistance
- Trendlines
- Moving averages
- Market structure
- Candlestick patterns
- Price-action signals
- Other technical indicators
Trading Strategy of Fibonacci Retracement
A practical Fibonacci Retracement Strategy should not rely on a Fibonacci level alone. The strongest approach is to combine Fibonacci with market structure, support and resistance, and price action confirmation. A simple trading framework is:
Identify Trend → Find Swing Points → Draw Fibonacci → Wait for Pullback → Confirm Price Action → Enter → Set Stop-Loss → Manage Risk
Fibonacci Pullback Strategy
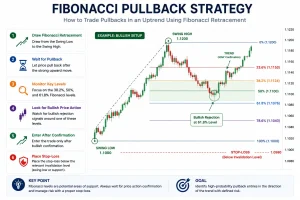
Suppose a market is in a clear uptrend and has recently moved from a significant Swing Low to a Swing High. The trader can:
- Draw Fibonacci Retracement from the Swing Low to the Swing High
- Wait for price to pull back
- Monitor the 38.2%, 50%, and 61.8% levels
- Look for bullish price action around one of these areas
- Enter only after confirmation
- Place the stop-loss below the relevant invalidation level
Read More: What is MACD Indicator? How to Use it?
Combining Fibonacci with Price Action
Price action can help determine whether a Fibonacci level is actually being respected. Potential confirmation signals include:
- Bullish or bearish rejection candles
- Engulfing patterns
- Break of a recent swing high or low
- Higher highs and higher lows
- Lower highs and lower lows
For example, a 61.8% Fibonacci level that overlaps with previous support and produces a bullish rejection may be more significant than a 61.8% level appearing in isolation.
Fibonacci and RSI
Fibonacci Retracement can also be combined with the RSI Indicator. For example, during an uptrend:
Price reaches Fibonacci support → RSI shows weakening bearish momentum → Bullish price action appears → Confirmation
This combination can provide additional context, but RSI should not be treated as confirmation by itself. The objective is to combine different types of information rather than relying on multiple indicators that provide essentially the same signal.
Read More: Best Forex Indicators in 2026
Stop-Loss and Take-Profit in
Stop-loss placement should be based on the trade invalidation level, not simply placed a fixed number of pips beyond a Fibonacci percentage. For example, if a bullish setup forms near the 61.8% level, the stop-loss could be positioned below a meaningful Swing Low or support zone if that level invalidates the trading idea. Potential take-profit areas can include:
- Previous Swing High
- Previous resistance
- Fibonacci Extension levels
- A predefined risk-to-reward target
Conclusion about Fibonacci Retracement
Fibonacci Retracement is a useful technical analysis tool for identifying potential pullback areas within a market trend. The 23.6%, 38.2%, 50%, 61.8%, and 78.6% levels provide reference points where traders can monitor price behavior. However, Fibonacci should not be treated as a standalone trading system.
Source: Investopedia









