
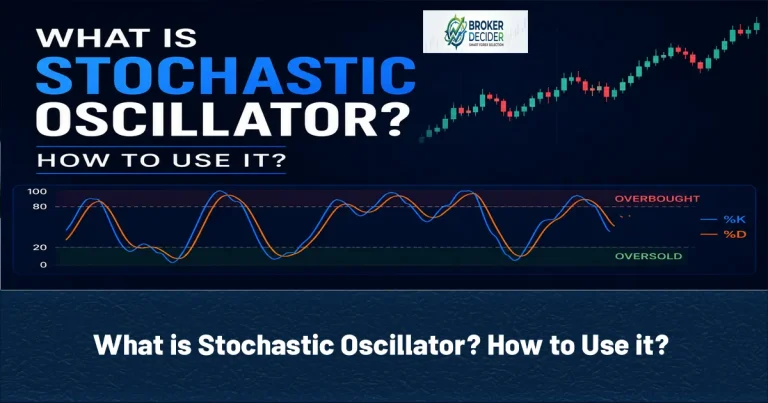
The Stochastic Oscillator is an indicator used in technical analysis to compare an asset’s closing price with its recent trading range. Traders commonly use it to analyze momentum, overbought and oversold conditions, and potential changes in price direction. Unlike trend-following indicators such as Moving Averages, the Stochastic Oscillator focuses on the relationship between the current closing price and the recent high-low range. The indicator moves between 0 and 100, which makes its readings relatively easy to interpret.
Stochastic Oscillator
The Stochastic Oscillator was developed by George Lane and is based on the idea that, during an uptrend, prices often tend to close near the upper end of their recent range. During a downtrend, prices may tend to close closer to the lower end. The indicator consists of two main lines:
- %K Line: The faster and primary Stochastic line.
- %D Line: A moving average of the %K line and generally the slower signal line.
The interaction between these two lines can provide information about changes in short-term momentum. However, a Stochastic crossover should not automatically be treated as a buy or sell signal. Market structure and price action can provide important additional confirmation.
Stochastic Oscillator Function
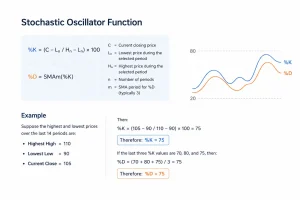
The Stochastic Oscillator measures where the current closing price is positioned relative to the highest high and lowest low over a selected period. Stochastic Oscillator has %K line and %D line. each can be calculated with its own formula:
%K= (C−Lₙ/Hₙ-Lₙ)*100
- C = Current closing price
- Lₙ = Lowest price during the selected period
- Hₙ = Highest price during the selected period
- n = Number of periods
%D= SMAm(%K)
This means %D is a Simple Moving Average (SMA) of %K over m periods. The commonly used setting is a 3-period SMA.
Example of Stochastic Oscillator Function
Suppose the highest and lowest prices over the last 14 periods are:
- Highest High = 110
- Lowest Low = 90
- Current Close = 105
Then:
Therefore:
%K = 75
If the last three %K values are 70, 80, and 75, then:
%D= (70 + 80 + 75)/3= 75
Therefore:
%D = 75
Read More: What is ATR Indicator? How to Use it?
Stochastic Indicator Settings
The traditional Stochastic Oscillator commonly uses 14, 3, 3 settings. These numbers generally represent:
- 14: The lookback period used to calculate %K
- 3: The smoothing period applied to %K
- 3: The period used to calculate the %D signal line
Different settings can change the sensitivity of the indicator:
| Stochastic Indicator Settings | Behavior |
| 5, 3, 3 | Faster and more sensitive |
| 9, 3, 3 | More responsive to short-term movements |
| 14, 3, 3 | Common standard setting |
| 21, 3, 3 | Smoother and slower |
Shorter settings can produce earlier signals, but they may also create more noise and false signals. Longer settings provide smoother readings but can react more slowly to changes in momentum.
Overbought and Oversold Levels in Stochastic Oscillator
The two most commonly monitored levels are 20 and 80.
- 0-20 = Oversold zone
- 20-80 = Neutral range
- 80-100 = Overbought zone
When the Stochastic Oscillator moves above 80, the market may be considered overbought. When it falls below 20, the market may be considered oversold. However, overbought does not automatically mean sell, and oversold does not automatically mean buy. A strong bullish trend can keep the indicator above 80 for an extended period, while a strong bearish trend can keep it below 20. Therefore, the Stochastic Oscillator is generally more useful when combined with market structure, support and resistance, and price action confirmation. In the next section, we will examine %K and %D crossovers, bullish and bearish divergence, overbought and oversold signals, and how the Stochastic Oscillator behaves in trending and ranging markets.
Read More: What is VWAP Indicator? How to Use it?
Reading the Stochastic Oscillator
The Stochastic Oscillator can provide more information when traders focus on the relationship between the %K and %D lines, rather than relying only on the 20 and 80 levels:
%K and %D Crossovers
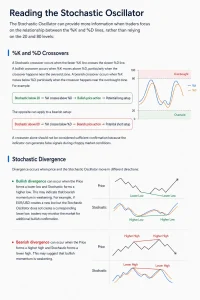
A Stochastic crossover occurs when the faster %K line crosses the slower %D line. A bullish crossover occurs when %K moves above %D, particularly when the crossover happens near the oversold zone. A bearish crossover occurs when %K moves below %D, particularly when the crossover happens near the overbought zone. For example:
Stochastic below 20 → %K crosses above %D → Bullish price action → Potential long setup
The opposite can apply to a bearish setup:
Stochastic above 80 → %K crosses below %D → Bearish price action → Potential short setup
A crossover alone should not be considered sufficient confirmation because the indicator can generate false signals during choppy market conditions.
Stochastic Divergence
Divergence occurs when price and the Stochastic Oscillator move in different directions:
- Bullish divergence can occur when the Price forms a lower low and Stochastic forms a higher low. This may indicate that bearish momentum is weakening. For example, if EUR/USD creates a new low but the Stochastic Oscillator does not create a corresponding lower low, traders may monitor the market for additional bullish confirmation.
- Bearish divergence can occur when the Price forms a higher high and Stochastic forms a lower high. This may suggest that bullish momentum is weakening.
Read More: EMA vs SMA (What’s The difference?)
Trending Markets and Stochastic
The behavior of the Stochastic Oscillator can be different in strong trends. During a strong bullish trend, the indicator may remain near or above the 80 level for an extended period. Selling simply because the Stochastic becomes overbought can therefore result in entering against a strong trend. Similarly, during a strong bearish trend, Stochastic can remain below 20 for a long time. A better approach is to use the indicator alongside market structure. For example:
Uptrend → Pullback → Stochastic moves below 20 → Bullish price action → Potential continuation
Ranging Markets and Stochastic
The Stochastic Oscillator can be particularly useful when price is moving sideways between clearly defined support and resistance levels. Suppose price repeatedly moves between a support zone and a resistance zone. A trader may monitor this for a potential long setup:
Support + Stochastic below 20 + Bullish confirmation
At the opposite side this may provide a potential short setup:
Resistance + Stochastic above 80 + Bearish confirmation
Stochastic Oscillator and RSI
Both the Stochastic Oscillator and RSI are momentum indicators, but they measure momentum differently.
| Features | Stochastic Indicator | RSI |
| Main focus | Close relative to recent range | Strength of recent price changes |
| overbought level | 80 | 70 |
| oversold level | 20 | 30 |
| Scale | 0–100 | 0–100 |
| Common use | Momentum and timing | Momentum and market conditions |
| Main lines | %K and %D | RSI line |
Read More: What is Bollinger Bands Indicator? How to Use it?
Stochastic Indicator Trading Strategy
A practical Stochastic Oscillator Trading Strategy should use the indicator as a confirmation tool rather than as a standalone entry system. Combining Stochastic with market structure, support and resistance, and price action can help filter weaker signals.
Stochastic Pullback Strategy
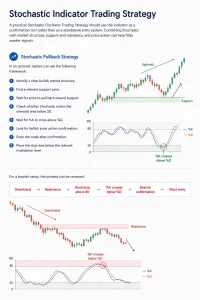
In an uptrend, traders can use the following framework:
- Identify a clear bullish market structure.
- Find a relevant support zone.
- Wait for price to pull back toward support.
- Check whether Stochastic enters the oversold area below 20.
- Wait for %K to cross above %D.
- Look for bullish price action confirmation.
- Enter the trade after confirmation.
- Place the stop-loss below the relevant invalidation level.
For a bearish setup, the process can be reversed:
Downtrend → Resistance → Stochastic above 80 → %K crosses below %D → Bearish confirmation → Short entry
Stochastic Indicator and Support and Resistance
Support and resistance can provide important context for Stochastic signals. For example, suppose EUR/USD reaches a well-established support zone while Stochastic falls below 20. If price then forms a bullish rejection candle and %K crosses above %D, the combination may provide a stronger potential long setup. The same principle can be applied to resistance that can provide a potential short setup:
Resistance + Overbought Stochastic + Bearish Price Action
Stop-Loss and Take-Profit in Stochastic Oscillator
Stop-loss placement should be based primarily on the market structure and trade invalidation level. For a long position, the stop-loss can be placed below a meaningful support zone or recent Swing Low. For a short position, it can be placed above a relevant resistance zone or Swing High. Potential take-profit areas include:
- Previous Swing High or Low
- Major support or resistance
- A predefined risk-to-reward ratio
- Relevant market structure levels
Read More: What is MACD Indicator? How to Use it?
Final Thoughts about Stochastic Oscillator
The Stochastic Oscillator is a useful momentum indicator for analyzing overbought and oversold conditions, crossovers, and potential momentum changes.
Source: Investopedia









