
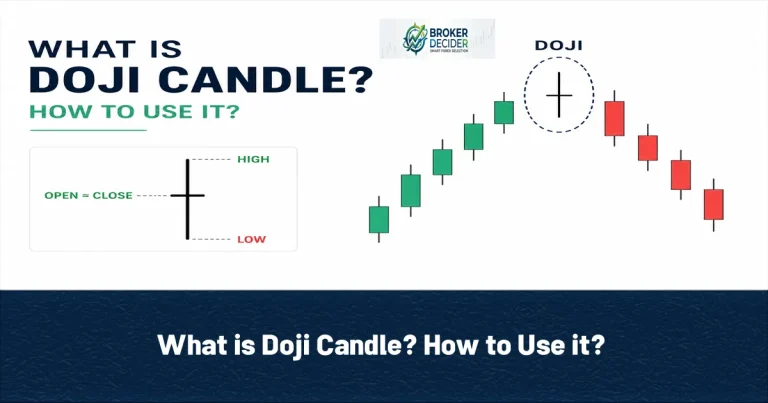
The Doji Candle is one of the most well-known candlestick patterns in technical analysis. It forms when the opening and closing prices of an asset are nearly the same during a specific period. A Doji usually indicates market indecision. Buyers and sellers may both have tried to move the price, but neither side was able to maintain control by the end of the candle. However, a Doji does not automatically mean that the market will reverse. Traders usually combine it with support and resistance, trend direction, volume, and other technical indicators to confirm a potential trading opportunity.
What is Doji Candle?
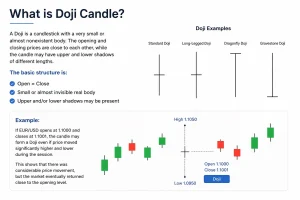
A Doji is a candlestick with a very small or almost nonexistent body. The opening and closing prices are close to each other, while the candle may have upper and lower shadows of different lengths. The basic structure is:
- Open ≈ Close
- Small or almost invisible real body
- Upper and/or lower shadows may be present
For example, if EUR/USD opens at 1.1000 and closes at 1.1001, the candle may form a Doji even if price moved significantly higher and lower during the session. This shows that there was considerable price movement, but the market eventually returned close to the opening level.
Read More: What is Engulfing Pattern? How to Use it?
Why Doji Forms?
A Doji can develop for several reasons. Sometimes buyers and sellers genuinely reach a temporary balance. In other cases, price experiences strong volatility in both directions before finishing close to its opening price. For example:
Strong buying → Sellers respond → Price falls → Buyers recover → Close near Open
The resulting Doji does not tell us which side will win next. It simply shows that the previous directional pressure did not produce a decisive closing result. This distinction is important when using the pattern in real trading.
Types of Doji Candle
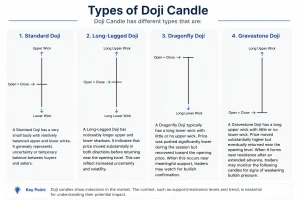
Doji Candle has different types that are:
- Standard Doji: A Standard Doji has a very small body with relatively balanced upper and lower wicks. It generally represents uncertainty or temporary balance between buyers and sellers.
- Long-Legged Doji: A Long-Legged Doji has noticeably longer upper and lower shadows. It indicates that price moved substantially in both directions before returning near the opening level. This can reflect increased uncertainty and volatility.
- Dragonfly Doji: A Dragonfly Doji typically has a long lower wick with little or no upper wick. Price was pushed significantly lower during the session but recovered toward the opening price. When this occurs near meaningful support, traders may watch for bullish confirmation.
- Gravestone Doji: A Gravestone Doji has a long upper wick with little or no lower wick. Price moved substantially higher but eventually returned near the opening level. When it forms near resistance after an extended advance, traders may monitor the following candles for signs of weakening bullish pressure.
Read More: What is ADX Indicator? How to Use it?
Reading a Doji Candle
The real value of a Doji Candle comes from its location on the chart. The same Doji can have completely different implications depending on what price was doing before it appeared. A Doji after a strong rally deserves a different interpretation from one that forms inside a quiet sideways market.
Doji at Support
Suppose price has been falling toward a well-established support zone. Sellers have controlled the move, but a Doji appears directly around that area. This can suggest that selling pressure is no longer producing the same decisive results. However, the Doji itself is not enough to justify a long position. Traders may wait for the next candle to show bullish intent, such as a strong bullish close or a break above the Doji’s high. A simple sequence could be:
Downtrend → Support → Doji → Bullish Confirmation
Doji at Resistance
The opposite situation can occur after a strong advance. If price reaches resistance and forms a Doji, buyers may be struggling to push the market higher. Traders can then watch the following candles for evidence that sellers are taking control. A potential sequence is:
Uptrend → Resistance → Doji → Bearish Confirmation
Doji During a Trend
A Doji does not always indicate a reversal. Imagine a strong bullish trend where price pauses for one candle and produces a Doji. If the following candles continue higher, the Doji may simply represent a brief pause before the trend resumes. This is why traders should avoid the common assumption: Doji = Reversal. A better interpretation is:
Doji = Market hesitation → Wait for additional information
Confirmation with Doji Candle
Confirmation can come from the candle that follows the Doji or from the broader market structure. For a potential bullish setup, traders might look for:
- Doji near support
- Bullish candle following the Doji
- Break above the Doji high
- Higher low forming on the chart
For a potential bearish setup:
- Doji near resistance
- Bearish candle following the Doji
- Break below the Doji low
- Lower high forming on the chart
The more independent factors point in the same direction, the more meaningful the setup may become.
Doji Candle and Spinning Top
A Doji and a Spinning Top can look similar, but they are not identical. A Doji generally has an extremely small real body because the opening and closing prices are very close. A Spinning Top has a small body as well, but the difference between its opening and closing prices is usually more noticeable. Both can reflect uncertainty, but the distinction is based primarily on the size of the real body.
Doji Candle in Different Timeframes
A Doji on a 5-minute chart represents uncertainty during a short period, while a Doji on a daily chart reflects the battle between buyers and sellers throughout an entire trading day. Therefore, traders should always consider the timeframe. A Doji on a higher timeframe can carry more significance when it appears at a major technical level, while lower-timeframe Dojis can occur frequently because of ordinary market noise.
Doji Candle Trading Strategy
A Doji Candle is most useful when it is treated as a market context signal, not as an automatic buy or sell signal. The candle shows that buyers and sellers reached a temporary balance, but the next price movement determines whether that balance develops into a reversal, continuation, or simple pause. A practical Doji Candle trading strategy therefore combines the pattern with support and resistance, trend direction, price action, and confirmation from the following candle.
How to Enter a Trade After a Doji Candle?
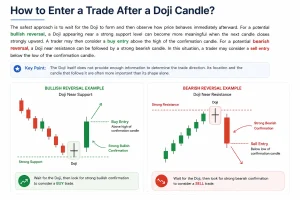
The safest approach is to wait for the Doji to form and then observe how price behaves immediately afterward. For a potential bullish reversal, a Doji appearing near a strong support level can become more meaningful when the next candle closes strongly upward. A trader may then consider a buy entry above the high of the confirmation candle.
For a potential bearish reversal, a Doji near resistance can be followed by a strong bearish candle. In this situation, a trader may consider a sell entry below the low of the confirmation candle. The important point is that the Doji itself does not provide enough information to determine the trade direction. Its location and the candle that follows it are often more important than its shape alone.
Doji Candle Stop-Loss Placement
Stop-loss placement should reflect the structure of the setup rather than an arbitrary number of pips. In a bullish setup, the stop-loss can generally be positioned below the Doji’s low or below the nearby support area. If price breaks that level, the bullish reversal idea becomes weaker. In a bearish setup, the stop-loss can be placed above the Doji’s high or above the relevant resistance zone. For example, imagine EUR/USD is approaching a well-established support level and forms a Doji. The following candle closes bullish and confirms the setup. A trader could enter above the confirmation candle while placing the stop-loss below the nearby support structure. This approach gives the trade a clear invalidation point.
Take-Profit Strategy with Doji Candle
Take-profit placement should also be based on market structure. Instead of assuming that every Doji will produce a large reversal, traders can identify the next important support or resistance zone as a potential target. In a bullish trade, the next resistance area may become the first target.
In a bearish trade, the next support level can serve as a potential target. Risk-to-reward ratio is another useful consideration. For example, if a setup risks 20 pips and targets 40 pips, the potential reward is twice the initial risk, giving the trade a 1:2 risk-to-reward ratio. However, the ratio should not be forced onto every setup. A realistic target based on price structure is generally more useful than an arbitrary target chosen simply to achieve a particular ratio.
Read More: What is ATR Indicator? How to Use it?
Doji Candle and Different Market Conditions
The same Doji Candle can have completely different meanings depending on the market environment. During a strong uptrend, a Doji does not automatically mean that the trend will reverse. It may simply indicate a temporary pause before buyers regain control. During a strong downtrend, the appearance of a Doji does not necessarily signal the beginning of a bullish reversal. Doji patterns become particularly interesting when they appear at major support or resistance levels, after an extended price movement, or alongside other reversal signals. In a ranging market, Doji candles can also appear frequently because neither buyers nor sellers have established clear control. In such conditions, traders should avoid treating every Doji as a trade opportunity.
Conclusion about Doji
The Doji Candle represents a period of indecision between buyers and sellers. Its real value comes from understanding where it appears and what happens afterward. A practical strategy is to wait for the Doji, identify the surrounding market structure, look for confirmation, define a logical invalidation point, and set a realistic target. Doji patterns work best as part of a broader price-action framework rather than as standalone trading signals. When combined with support and resistance, trend analysis, and disciplined risk management, they can help traders identify moments when the market may be preparing for a meaningful change in direction. The key lesson is simple: do not trade the Doji alone. Trade the market context that gives the Doji meaning.
Read More: What is VWAP Indicator? How to Use it?
Source: Investopedia









